Create 2-D Line Plot
Create a simple line plot and label the axes. Customize the appearance of plotted lines by changing the line color, the line style, and adding markers.
Create Line Plot
Create a two-dimensional line plot using theplotfunction. For example, plot the value of the sine function from 0 to
.
x = linspace(0,2*pi,100); y = sin(x); plot(x,y)
label the axes and add a title.
xlabel('x') ylabel('sin(x)') title('Plot of the Sine Function')

Plot Multiple Lines
By default, MATLAB clears the figure before each plotting command. Use thefigurecommand to open a new figure window. You can plot multiple lines using thehold oncommand. Until you usehold offor close the window, all plots appear in the current figure window.
figure x = linspace(0,2*pi,100); y = sin(x); plot(x,y) holdony2 = cos(x); plot(x,y2) holdoff

Change Line Appearance
You can change the line color, line style, or add markers by including an optional line specification when calling theplotfunction. For example:
':'plots a dotted line.'g:'plots a green, dotted line.'g:*'plots a green, dotted line with star markers.'*'plots star markers with no line.
The symbols can appear in any order. You do not need to specify all three characteristics (line color, style, and marker). For more information about the different style options, see theplotfunction page.
For example, plot a dotted line. Add a second plot that uses a dashed, red line with circle markers.
x = linspace(0,2*pi,50); y = sin(x); plot(x,y,':') holdony2 = cos(x); plot(x,y2,'--ro') holdoff

Plot only the data points by omitting the line style option from the line specification.
x = linspace(0,2*pi,25); y = sin(x); plot(x,y,'o')

Change Line Object Properties
You also can customize the appearance of the plot by changing properties of thelineobject used to create the plot.
Create a line plot. Assign thelineobject created to the variableln. The display shows commonly used properties, such asColor,lineStyle, andlineWidth.
x = linspace(0,2*pi,25); y = sin(x); ln = plot(x,y)
ln = Line with properties: Color: [0 0.4470 0.7410] LineStyle: '-' LineWidth: 0.5000 Marker: 'none' MarkerSize: 6 MarkerFaceColor: 'none' XData: [1x25 double] YData: [1x25 double] ZData: [1x0 double] Show all properties
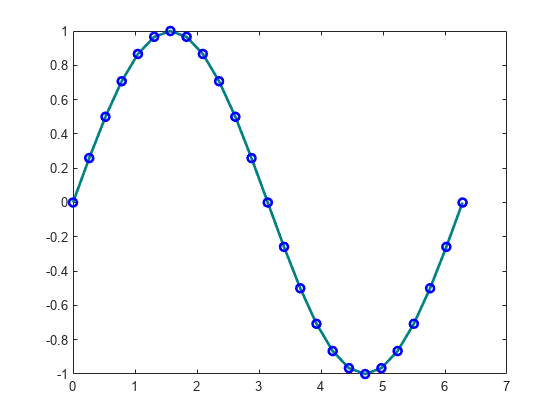
To access individual properties, use dot notation. For example, change the line width to 2 points and set the line color to an RGB triplet color value, in this case[0 0.5 0.5]. Add blue, circle markers.
ln.LineWidth = 2; ln.Color = [0 0.5 0.5]; ln.Marker ='o'; ln.MarkerEdgeColor ='b';
See Also
line Properties|loglog|plot|scatter
相关的话题
Select a Web Site
Choose a web site to get translated content where available and see local events and offers. Based on your location, we recommend that you select:.
Selectweb siteYou can also select a web site from the following list:
Americas
- América Latina(Español)
- Canada(English)
- United States(English)
Europe
- Belgium(English)
- 丹麦(English)
- Deutschland(Deutsch)
- España(Español)
- Finland(English)
- France(Français)
- Ireland(English)
- Italia(Italiano)
- luxembourg(English)
- Netherlands(English)
- 挪威(English)
- Österreich(Deutsch)
- Portugal(English)
- Sweden(English)
- Switzerland
- United Kingdom(English)
