Access Data in aMATLABFunction During Simulation
You can stream signal data to a MATLAB®callback function during simulation using theData Accessfunctionality in theInstrumentation Propertiesfor a signal. The function you provide receives data in packets asynchronously throughout the simulation. The callback function executes each time it receives new data. You can write a callback function to process signal data during simulation or to create a custom visualization of a signal. The callback function does not affect signal values in your model. This example illustrates the steps required to access signal data during simulation using a simple callback function that plots the signal.
Note
Data access does not support Rapid Accelerator mode, referenced models, fixed-point data, or virtual bus signals and only supports 1-D and 2-D matrix signals.
Write a Callback Function for Data Access
The data access callback function always receives signal data as the first argument. You can choose whether to send the simulation time and a parameter. When you include all three arguments, simulation time is the second argument. Your callback function can be specific to a single signal, or you can use the same callback to process and visualize multiple signals. The callback function only has access to data for a single signal at a time. This example creates a callback function that receives signal data, time, and a parameter used to identify which signal the function is processing for a given call.
Note
The data access callback function receives nonvirtual bus data as a structure of arrays that matches the hierarchy of the bus.
Author your callback function in an m-file with the same name as your function. For more information about writing MATLAB functions, seeCreate Functions in Files. The example callback function uses the optional parameter to assign a numerical identifier to each signal. The parameter is used to create a unique figure for each signal and assign each signal a different line color. To accumulate signal data on the plot, the callback includeshold on. For each call to the callback, the function receives a portion of the signal data. You can use the callback to accumulate the packets if desired.
functionplotSignals(y,time,sigNum) figure(sigNum)ifisequal(sigNum,1) marker =“ro - - - - - -”;elseifisequal(sigNum,2) marker ='go-';elsemarker ='bo-';endholdon; plot(time,y,marker);end
The callback function provides no return values. If you specify the function with returns, the return data is discarded.
Tip
使用assigninto access data from the callback function in the base workspace.
Save the callback function in a location on the MATLAB path. If the location where you save the callback is not on the path, you can add it to the path. Right-click the directory containing the callback in theCurrent Foldersection in MATLAB and selectAdd to Path.
Configure Signals for Data Access
To access data for a signal with the data access callback, you need to log the signal. To mark a signal for logging, right-click the signal in your model and selectLog Selected Signals. To configure data access for the signal, right-click the logging badge and selectProperties. On theData Accesstab of theInstrumentation Properties, you can specify the name of your callback function, whether the callback function takes time as an argument, and the optional parameter value.
For example, open thevdpmodel and configure thex1andx2signals to use the callback from the previous section.
Enter
vdpin the MATLABCommand Window.选择
x1andx2signals. Then, right-click the selected signals and chooseLog Selected Signalsfrom the context menu.To open theInstrumentation Properties, right-click the logging badge for
x1and selectProperties.On theData Accesspane, enter the name of the callback, checkInclude simulation time, and enter
1as theFunction parameter.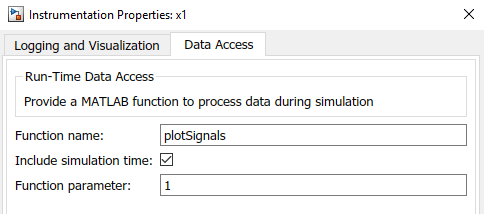
Open theInstrumentation Propertiesfor
x2和配置Data Accesspane to use theplotSignalscallback with aFunction parametervalue of2.

Simulate thevdpmodel. The callback generates Figures 1 and 2 to display thex1andx2signals during simulation.
You can modify the callback function to create a custom visualization or to create a plot of processed signal data. Errors related to the data access callback function do not interrupt simulation. The errors surface in theDiagnostic Vieweras a warning.
Related Topics
You can also select a web site from the following list:
Americas
- América Latina(Español)
- Canada(English)
- United States(English)
Europe
- Belgium(English)
- Denmark(English)
- Deutschland(Deutsch)
- España(Español)
- Finland(English)
- France(Français)
- Ireland(English)
- 意大利(Italiano)
- Luxembourg(English)
- Netherlands(English)
- Norway(English)
- Österreich(Deutsch)
- Portugal(English)
- Sweden(English)
- 瑞士人land
- 联合王国(English)