Create Map Displays with Geographic Data
There are many geospatial data sets that contain data with coordinates in latitude and longitude in units of degrees. This example illustrates how to import geographic data with coordinates in latitude and longitude, display geographic data in a map display, and customize the display.
在particular, this example illustrates how to
Import specific geographic vector and raster data sets
Create map displays and visualize the data
Display multiple data sets in a single map display
Customize a map display with a scale ruler and north arrow
Customize a map display with an inset map
Example 1: Import Polygon Geographic Vector Data
矢量地理数据可以存储在一个品种of different formats, for example shapefile and GPS Exchange (GPX) formats. This example imports polygon geographic vector data from a shapefile. Vertices in a shapefile can be either in geographic coordinates (latitude and longitude) or in a projected coordinate reference system.
Read USA state boundaries from theusastatehi.shpfile included with the Mapping Toolbox™ software. The state boundaries are in latitude and longitude.
states = shaperead('usastatehi.shp','UseGeoCoords',true);
Example 2: Display Polygon Geographic Vector Data
Display the polygon geographic vector data onto anaxesm-based map (previously referred to as map axes). Since the geographic extent is in the United States, you can useusamapto set up the map. Usegeoshowto project and display the geographic data onto the map. Display an ocean color in the background by setting the frame's face color.
figure ax = usamap('conus'); oceanColor = [0.3010 0.7450 0.9330]; landColor = [0.9290 0.6940 0.1250]; setm(ax,'FFaceColor',oceanColor) geoshow(states,'FaceColor',landColor) title({'Conterminous USA State Boundaries',...'Polygon Geographic Vector Data'})

Example 3: Import Point and Line Geographic Vector Data
Import point geographic vector data from theboston_placenames.gpxfile included with the Mapping Toolbox™ software. The file contains latitude and longitude coordinates of geographic point features in part of Boston, Massachusetts, USA. Use thereadgeotablefunction to read the GPX file and return a geospatial table with one row for each point and its attributes.
placenames = readgeotable('boston_placenames.gpx');
Import line vector data from thesample_route.gpxfile included with the Mapping Toolbox™ software. The file contains latitude and longitude coordinates for a GPS route from Boston Logan International Airport to The MathWorks, Inc in Natick Massachusetts, USA. Use thereadgeotablefunction to read the GPX file and return a geospatial table contains each point along the route.
route = readgeotable('sample_route.gpx');
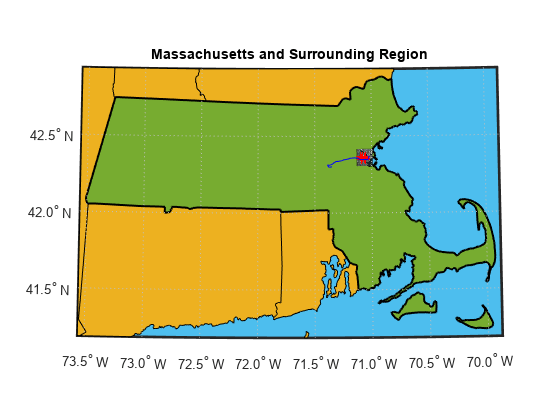
Example 4: Display Point and Line Geographic Vector Data
Display the geographic vector data in anaxesm-based map centered around the state of Massachusetts, using the data from the state boundaries and the GPX files. The coordinates for all of these data sets are in latitude and longitude.
Find the state boundary for Massachusetts.
stateName ='Massachusetts'; ma = states(strcmp({states.Name},stateName));
Useusamapto setup a map for the region surrounding Massachusetts. Color the ocean by setting the frame's face color. Display the state boundaries and highlight Massachusetts by usinggeoshowto display the geographic data onto the map. Since the GPX route is a set of points stored in ageopointshapevector, supply the latitude and longitude coordinates togeoshowto display the route as a line.
figure ax = usamap('ma'); maColor = [0.4660 0.6740 0.1880]; setm(ax,'FFaceColor',oceanColor) geoshow(states,'FaceColor',landColor) geoshow(ma,'FaceColor',maColor) geoshow(placenames); geoshow(route.Shape.Latitude,route.Shape.Longitude); title({'Massachusetts and Surrounding Region','Placenames and Route'})

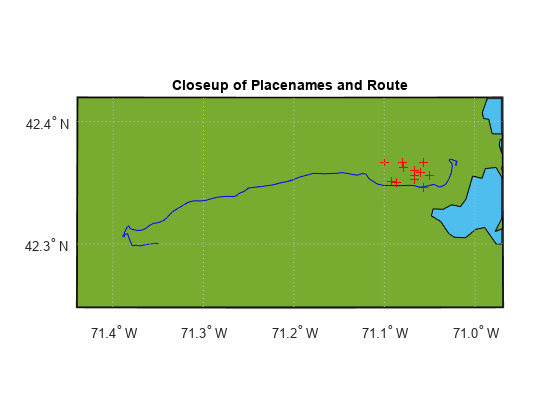
Example 5: Set Latitude and Longitude Limits Based on Data Extent
Zoom into the map by computing new latitude and longitude limits for the map using the extent of the placenames and route data. Extend the limits by 0.05 degrees.
lat = [route.Shape.Latitude; placenames.Shape.Latitude]; lon = [route.Shape.Longitude; placenames.Shape.Longitude]; [latlim,lonlim] = geoquadpt(lat,lon); [latlim,lonlim] = bufgeoquad(latlim,lonlim,0.05,0.05);
Construct anaxesm-based map with the new limits and display the geographic data.
figure ax = usamap(latlim,lonlim); setm(ax,'FFaceColor',oceanColor) geoshow(ma,'FaceColor',maColor) geoshow(placenames) geoshow(route.Shape.Latitude,route.Shape.Longitude) title('Closeup of Placenames and Route')
Example 6: Import Geographic Raster Data
地理栅格数据可以存储在一个品种of different formats, for example GeoTIFF, Esri Grid, DTED, and ENVI formats. To read data in these formats, use thereadgeorasterfunction.
To read an image associated with a worldfile, use theimreadandworldfilereadfunctions instead. Useimreadto read the image andworldfilereadto read the worldfile and construct a spatial referencing object. For this example, import data for the region surrounding Boston, Massachusetts. The coordinates of the image are in latitude and longitude.
filename ='boston_ovr.jpg'; RGB = imread(filename); R = worldfileread(getworldfilename(filename),'geographic',size(RGB));
Example 7: Display Geographic Raster Data
Display the RGB image onto anaxesm-based map. The limits of the map are set to the limits defined by the spatial referencing object,R. The coordinates of the data are in latitude and longitude.
figure ax = usamap(RGB,R); setm(ax,'MLabelLocation',0.05,'PLabelLocation',0.05,...'MLabelRound',-2,'PLabelRound',-2) geoshow(RGB,R) title('Boston Overview')

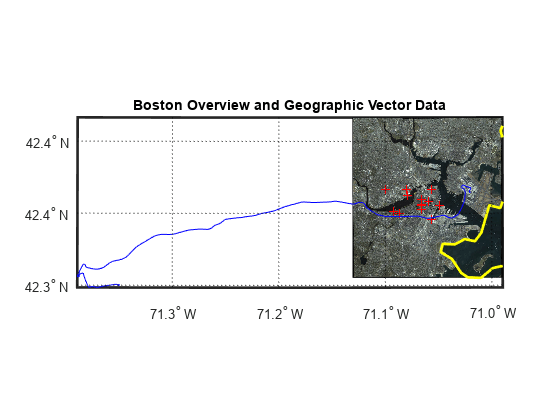
Example 8: Display Geographic Vector and Raster Data
You can display raster and vector data in a single map display. Since the coordinates for all of these data sets are in latitude and longitude, usegeoshowto display them in a single map display. Setup new limits based on the limits of the route, placenames, and the overview image.
lat = [route.Shape.Latitude' placenames.Shape.Latitude' R.LatitudeLimits]; lon = [route.Shape.Longitude' placenames.Shape.Longitude' R.LongitudeLimits]; [latlim,lonlim] = geoquadpt(lat,lon);
figure ax = usamap(latlim,lonlim); setm(ax,'GColor','k','PLabelLocation',0.05,'PLineLocation',0.05) geoshow(RGB,R) geoshow(ma.Lat,ma.Lon,'LineWidth',2,'Color','y') geoshow(placenames) geoshow(route.Shape.Latitude,route.Shape.Longitude) title('Boston Overview and Geographic Vector Data')
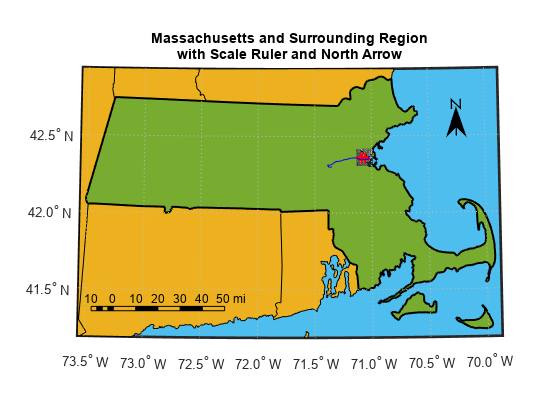
Example 9: Customize a Map Display with a Scale Ruler
Customize a map display by including a scale ruler. A scale ruler is a graphic object that shows distances on the ground at the correct size for the projection. This example illustrates how to construct a scale ruler that displays horizontal distances in international miles.
Compute latitude and longitude limits of Massachusetts and extend the limits by 0.05 degrees by using thebufgeoquadfunction.
[latlim,lonlim] = geoquadline(ma.Lat,ma.Lon); [latlim,lonlim] = bufgeoquad(latlim,lonlim,0.05,0.05);
Display the state boundary, placenames, route, and overview image onto the map.
figure ax = usamap(latlim,lonlim); setm(ax,'FFaceColor',oceanColor) geoshow(states,'FaceColor',landColor) geoshow(ma,'LineWidth',1.5,'FaceColor',maColor) geoshow(RGB,R) geoshow(placenames) geoshow(route.Shape.Latitude,route.Shape.Longitude) titleText ='Massachusetts and Surrounding Region'; title(titleText)
在sert a scale ruler. You can determine a location for the scale ruler by using theginputfunction as shown below:
[xLoc,yLoc] = ginput(1);
A location previously chosen is set below.
xLoc = -127800; yLoc = 5014700; scaleruler('Units','mi','RulerStyle','patches',...'XLoc',xLoc,'YLoc',yLoc); title({titleText,'with Scale Ruler'})

Example 10: Customize a Map Display with a North Arrow
Customize the map by adding a north arrow. A north arrow is a graphic element pointing to the geographic North Pole.
Use latitude and longitude values to position the north arrow.
northArrowLat = 42.5; northArrowLon = -70.25; northarrow('Latitude',northArrowLat,'Longitude',northArrowLon); title({titleText,'with Scale Ruler and North Arrow'})
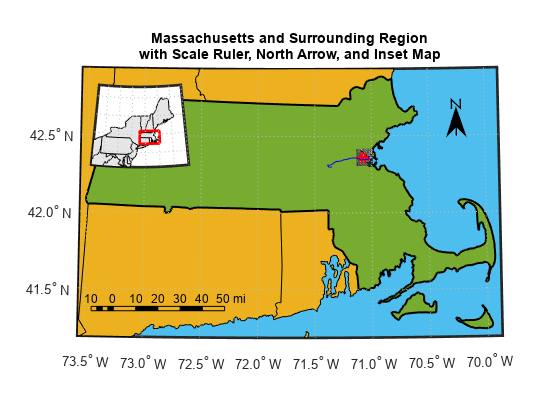
Example 11: Customize a Map Display with an Inset Map
Customize the map by adding an inset map. An inset map is a small map within a larger map that enables you to visualize the larger geographic region of your main map. Create a map for the surrounding region as an inset map. Use theaxes函数包含插页地图和位置。在the inset map:
Display the state boundaries for the surrounding region
Plot a red box to show the extent of the main map
h2 = axes('Position',[0.15 0.6 0.2 0.2],'Visible','off'); usamap({'PA','ME'}) plabeloffmlabeloffsetm(h2,'FFaceColor','w') geoshow(states,'FaceColor',[0.9 0.9 0.9],'Parent',h2) plotm(latlim([1 2 2 1 1]),lonlim([2 2 1 1 2]),...'Color','red','LineWidth',2) title(ax,{titleText,'with Scale Ruler, North Arrow, and Inset Map'})
Data Set Information
The fileboston_placenames.gpxis from the Bureau of Geographic Information (MassGIS), Commonwealth of Massachusetts, Executive Office of Technology and Security Services. For more information about the data sets, use the commandtype boston_placenames_gpx.txt.
The fileboston_ovr.jpgincludes materials copyrighted by GeoEye, all rights reserved. GeoEye was merged into the DigitalGlobe corporation on January 29th, 2013. For more information about the data set, use the commandtype boston_ovr.txt.
See Also
You can also select a web site from the following list:
Americas
- América Latina(Español)
- Canada(English)
- United States(English)
Europe
- Belgium(English)
- Denmark(English)
- Deutschland(Deutsch)
- España(Español)
- Finland(English)
- France(Français)
- Ireland(English)
- Italia(Italiano)
- Luxembourg(English)
- Netherlands(English)
- Norway(English)
- Österreich(Deutsch)
- Portugal(English)
- Sweden(English)
- Switzerland
- United Kingdom(English)