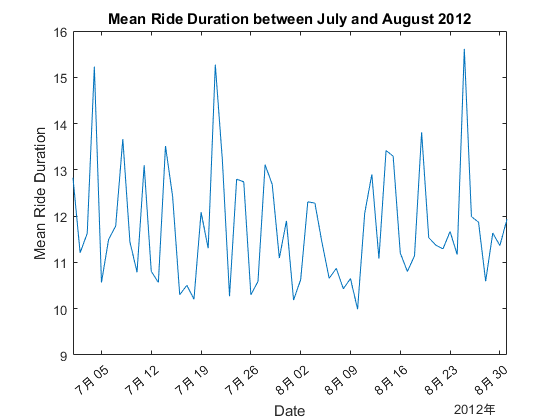
这是一个如何在MATLAB®中创建日期时间图的示例。
在MATLAB文档中阅读“datetime”函数和“axes-properties#prop_XAxis”属性。该功能在R2016b或更新版本中可用。
更多的例子,去MATLAB Plot Gallery -//www.tianjin-qmedu.com/discovery/gallery.html
引用作为
MathWorks地块画廊团队(2021年)。MATLAB Plot Gallery - Datetime Plot (1)(//www.tianjin-qmedu.com/matlabcentral/fileexchange/63450-matlab-plot-gallery-datetime-plot-1), MATLAB中央文件交换。检索.