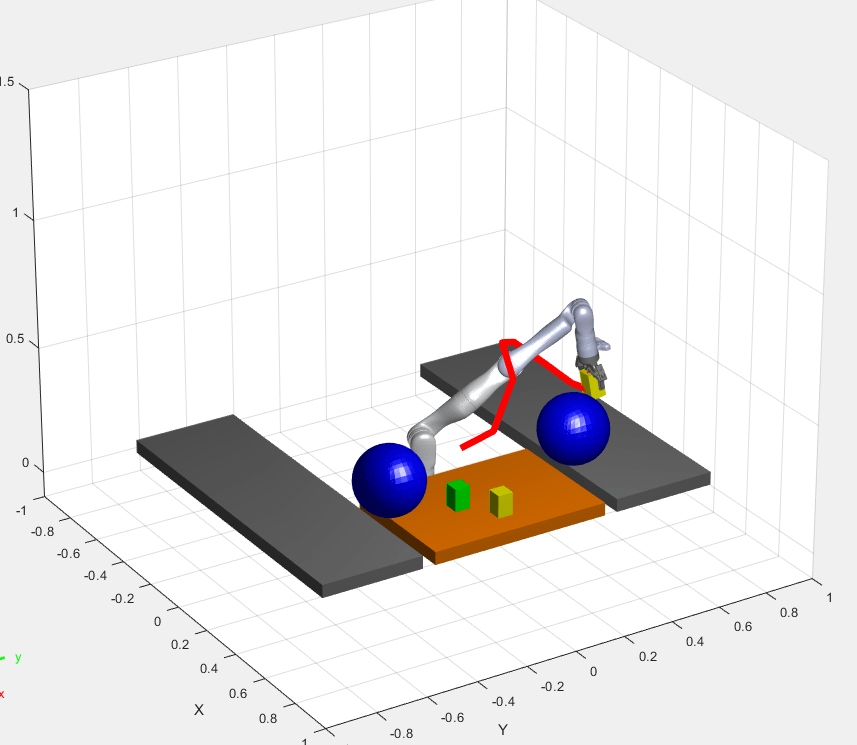
Execution inMATLAB
Execute standalone Stateflow®charts as objects in MATLAB®
Design logic by using state charts and execute that logic as MATLAB programs. Execute and unit test your chart in the Stateflow editor. Control the behavior of user interfaces and data processing applications through your chart.
Functions
Stateflow Syntax
Topics
- Create Stateflow Charts for Execution as MATLAB Objects
Save standalone Stateflow charts outside of Simulink®models.
- Execute and Unit Test Stateflow Chart Objects
Run Stateflow charts in MATLAB or through the Stateflow Editor.
- Execute Stateflow Chart Objects Through Scripts and Models
Create a MATLAB script or a Simulink model that invokes a standalone Stateflow chart.
- Convert MATLAB Code into Stateflow Flow Charts
Produce flow charts from your MATLAB code.
Troubleshooting
Debug a Standalone Stateflow Chart
Interrupt execution to step through each action in a Stateflow chart.


