iqimbal
Apply I/Q imbalance to input signal
Description
Examples
Apply Amplitude Imbalance to 16-QAM
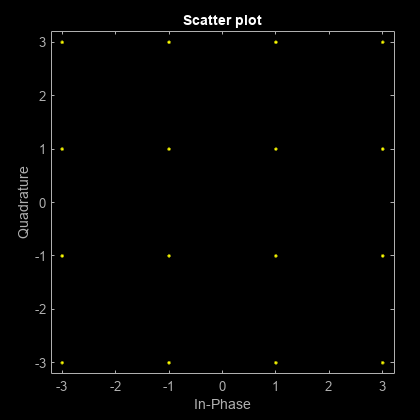
Generate a 16-QAM signal. Display the scatter plot.
x = qammod(randi([0 15],1000,1),16); h = scatterplot(x); holdon
Apply a 10 dB amplitude imbalance. A positive amplitude imbalance causes horizontal stretching of the constellation.
y = iqimbal(x,10); scatterplot(y,1,0,'ro',h)
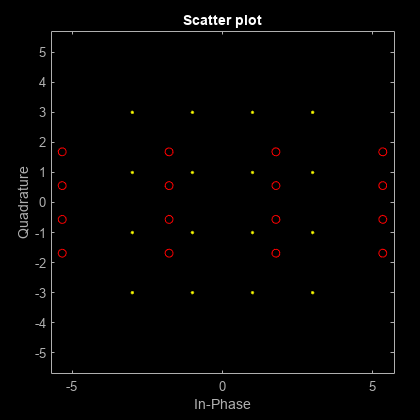
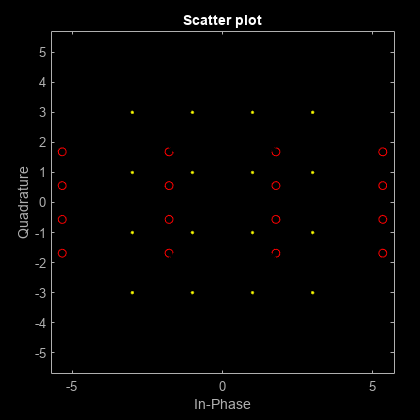
Apply a -10 dB amplitude imbalance. A negative amplitude imbalance causes vertical stretching of the constellation.
z = iqimbal(x,-10); scatterplot(z,1,0,'k*',h) holdoff
Apply Phase and Amplitude Imbalance to 16-QAM Signal
Generate a 16-QAM signal having two channels.
x = qammod(randi([0 15],1000,2),16);
Apply a 3 dB amplitude imbalance and a 10 degree phase imbalance to the first channel. Apply a –5 dB amplitude imbalance and a –15 degree phase imbalance to the second channel.
y = iqimbal(x,[3 -5],[10 -15]);
Plot the constellation diagram of both channels of the impaired signal.
h = scatterplot(y(:,1),1,0,'b*'); holdonscatterplot(y(:,2),1,0,'ro',h) holdoff

The first channel is stretched horizontally, and the second channel is stretched vertically.
Apply I/Q Imbalance and DC Offset to QPSK
Apply a 1 dB, 5 degree I/Q imbalance to a QPSK signal. Then apply a DC offset. Visualize the offset using a spectrum analyzer.
Generate a QPSK sequence.
x = pskmod(randi([0 3],1e4,1),4,pi/4);
Apply a 1 dB amplitude imbalance and 5 degree phase imbalance to a QPSK signal. Apply a 0.5 + 0.3i DC offset.
y = iqimbal(x,1,5); z = y + complex(0.5,0.3);
Plot the spectrum of the impaired signal.
sa = dsp.SpectrumAnalyzer('SampleRate',1000,'YLimits',[-50 30]); sa(z)

Display the corresponding scatter plot.
scatterplot(z) grid

The effect of the I/Q imbalance and the DC offset is observable.
Correct I/Q Imbalance on Noisy 8-PSK Signal
Generate random data and apply 8-PSK modulation.
data = randi([0 7],2000,1); txSig = pskmod(data,8,pi/8);
Pass the transmitted signal through an AWGN channel. Apply an I/Q imbalance.
noisySig = awgn(txSig,20); rxSig = iqimbal(noisySig,2,20);
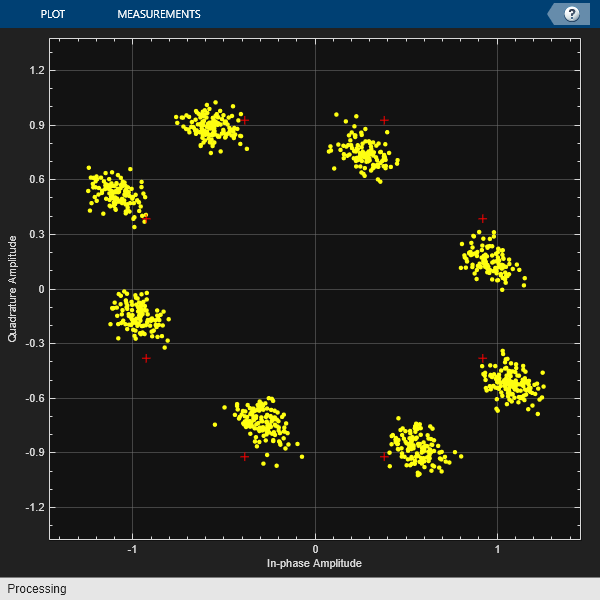
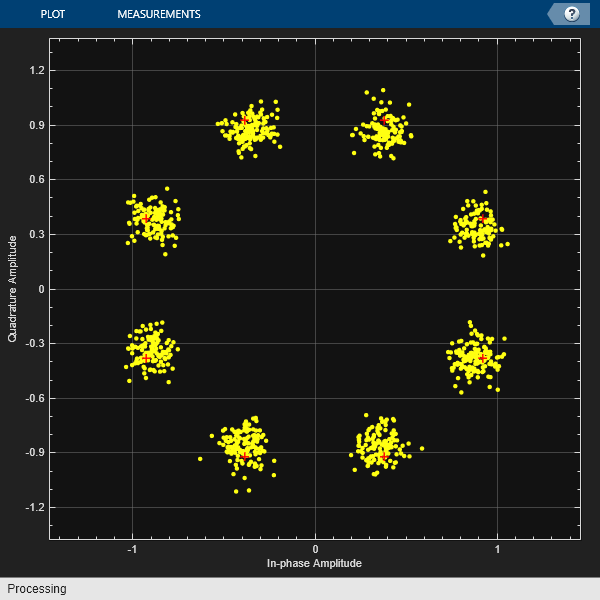
Create a constellation diagram object that displays only the last 1000 symbols. Plot the constellation diagram of the impaired signal.
cd = comm.ConstellationDiagram('ReferenceConstellation',pskmod(0:7,8,pi/8),...'SymbolsToDisplaySource','Property','SymbolsToDisplay',1000); cd(rxSig)
Correct for the I/Q imbalance by using acomm.IQImbalanceCompensatorobject. Plot the constellation diagram of the signal after compensation.
iqComp = comm.IQImbalanceCompensator('StepSize',1e-3); compSig = iqComp(rxSig); cd(compSig)
The compensator removes the I/Q imbalance.
Input Arguments
Output Arguments
Algorithms
Theiqimbalfunction applies an I/Q amplitude and phase imbalance to an input signal.
Given amplitude imbalanceIain dB, the gain,g, resulting from the imbalance is defined as
Applying the I/Q imbalance to input signalxresults in output signalysuch that
wheregis the imbalance gain andIpis the phase imbalance in degrees.
Extended Capabilities
Version History
You can also select a web site from the following list:
Americas
- América Latina(Español)
- Canada(English)
- United States(English)
Europe
- Belgium(English)
- Denmark(English)
- Deutschland(Deutsch)
- España(Español)
- Finland(English)
- France(Français)
- Ireland(English)
- Italia(Italiano)
- Luxembourg(English)
- Netherlands(English)
- Norway(English)
- Österreich(Deutsch)
- Portugal(English)
- Sweden(English)
- Switzerland
- United Kingdom(English)