SpecifytInnovation Distribution Using Econometric Modeler App
This example shows how to specify atinnovation distribution for an ARIMA model by using theEconometric Modeler应用程序。The example also shows how to fit the model to data. The data set, which is stored inData_JAustralian.mat, contains the log quarterly Australian Consumer Price Index (CPI) measured from 1972 and 1991, among other time series.
Import Data into Econometric Modeler
At the command line, load theData_JAustralian.matdata set.
loadData_JAustralian
Convert the tableDataTableto a timetable:
Clear the row names of
DataTable.Convert the sampling times to a
datetimevector.Convert the table to a timetable by associating the rows with the sampling times in
dates.
DataTable.Properties.RowNames = {}; dates = datetime(dates,'ConvertFrom','datenum',...'Format','ddMMMyyyy','Locale','en_US'); DataTable = table2timetable(DataTable,'RowTimes',dates);
At the command line, open theEconometric Modeler应用程序。
econometricModeler
Alternatively, open the app from the apps gallery (seeEconometric Modeler).
ImportDataTableinto the app:
On theEconometric Modelertab, in theImport部分中,点击
 .
.In theImport Datadialog box, in theImport?column, select the check box for the
DataTablevariable.ClickImport.
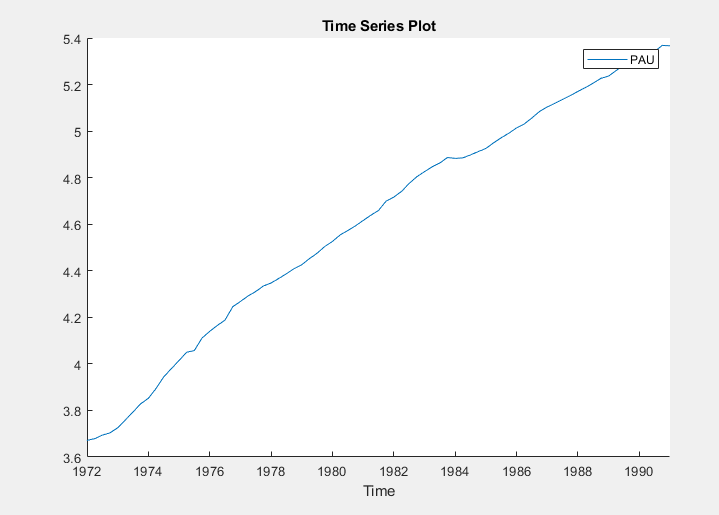
The variables, includingPAU, appear in theTime Seriespane, and a time series plot containing all the series appears in theTime Series Plot(EXCH)figure window.
Create a time series plot ofPAUby double-clickingPAUin theTime Seriespane.
Specify and Estimate ARIMA Model
Estimate an ARIMA(2,1,0) model for the log quarterly Australian CPI. Specify atinnovation distribution. (For details, seeImplement Box-Jenkins Model Selection and Estimation Using Econometric Modeler AppandPerform ARIMA Model Residual Diagnostics Using Econometric Modeler App.)
In theTime Seriespane, select the
PAUtime series.On theEconometric Modelertab, in theModels部分中,点击ARIMA.
In theARIMA Model Parametersdialog box, on theLag Ordertab:
Set theDegree of Integrationto
1.Set theAutoregressive Orderto
2.Click theInnovation Distributionbutton, then select
t.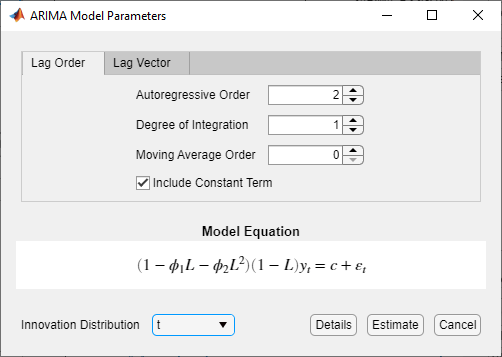
ClickEstimate.

The model variableARIMA_PAUappears in theModelspane, its value appears in thePreviewpane, and its estimation summary appears in theModel Summary(ARIMA_PAU)document.
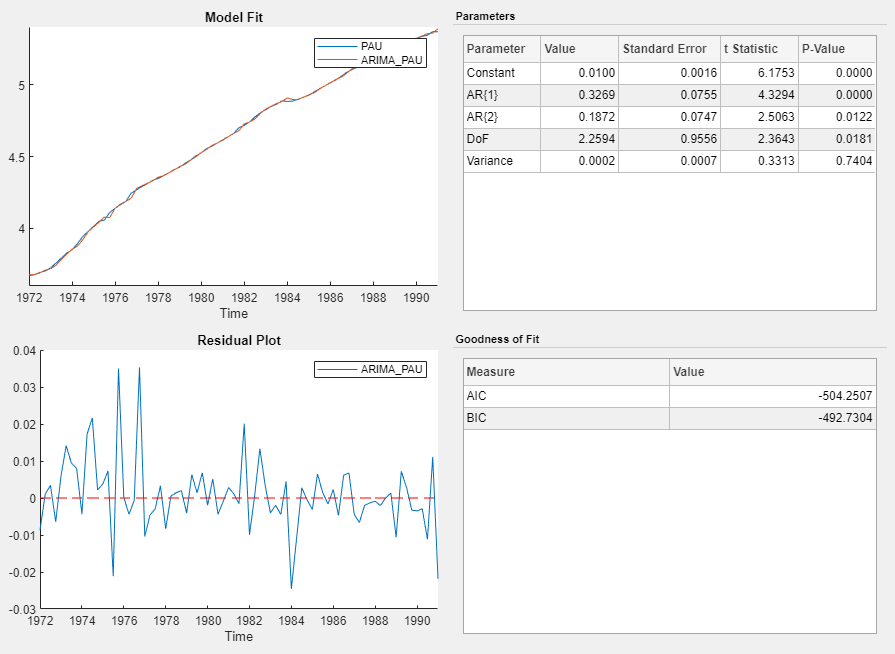
The app estimates thetinnovation degrees of freedom (DoF) along with the model coefficients and variance.
See Also
Apps
Objects
Functions
Related Topics
You can also select a web site from the following list:
Americas
- América Latina(Español)
- Canada(English)
- United States(English)
Europe
- Belgium(English)
- Denmark(English)
- Deutschland(Deutsch)
- España(Español)
- Finland(English)
- France(Français)
- Ireland(English)
- Italia(Italiano)
- Luxembourg(English)
- Netherlands(English)
- Norway(English)
- Österreich(Deutsch)
- Portugal(English)
- Sweden(English)
- Switzerland
- United Kingdom(English)