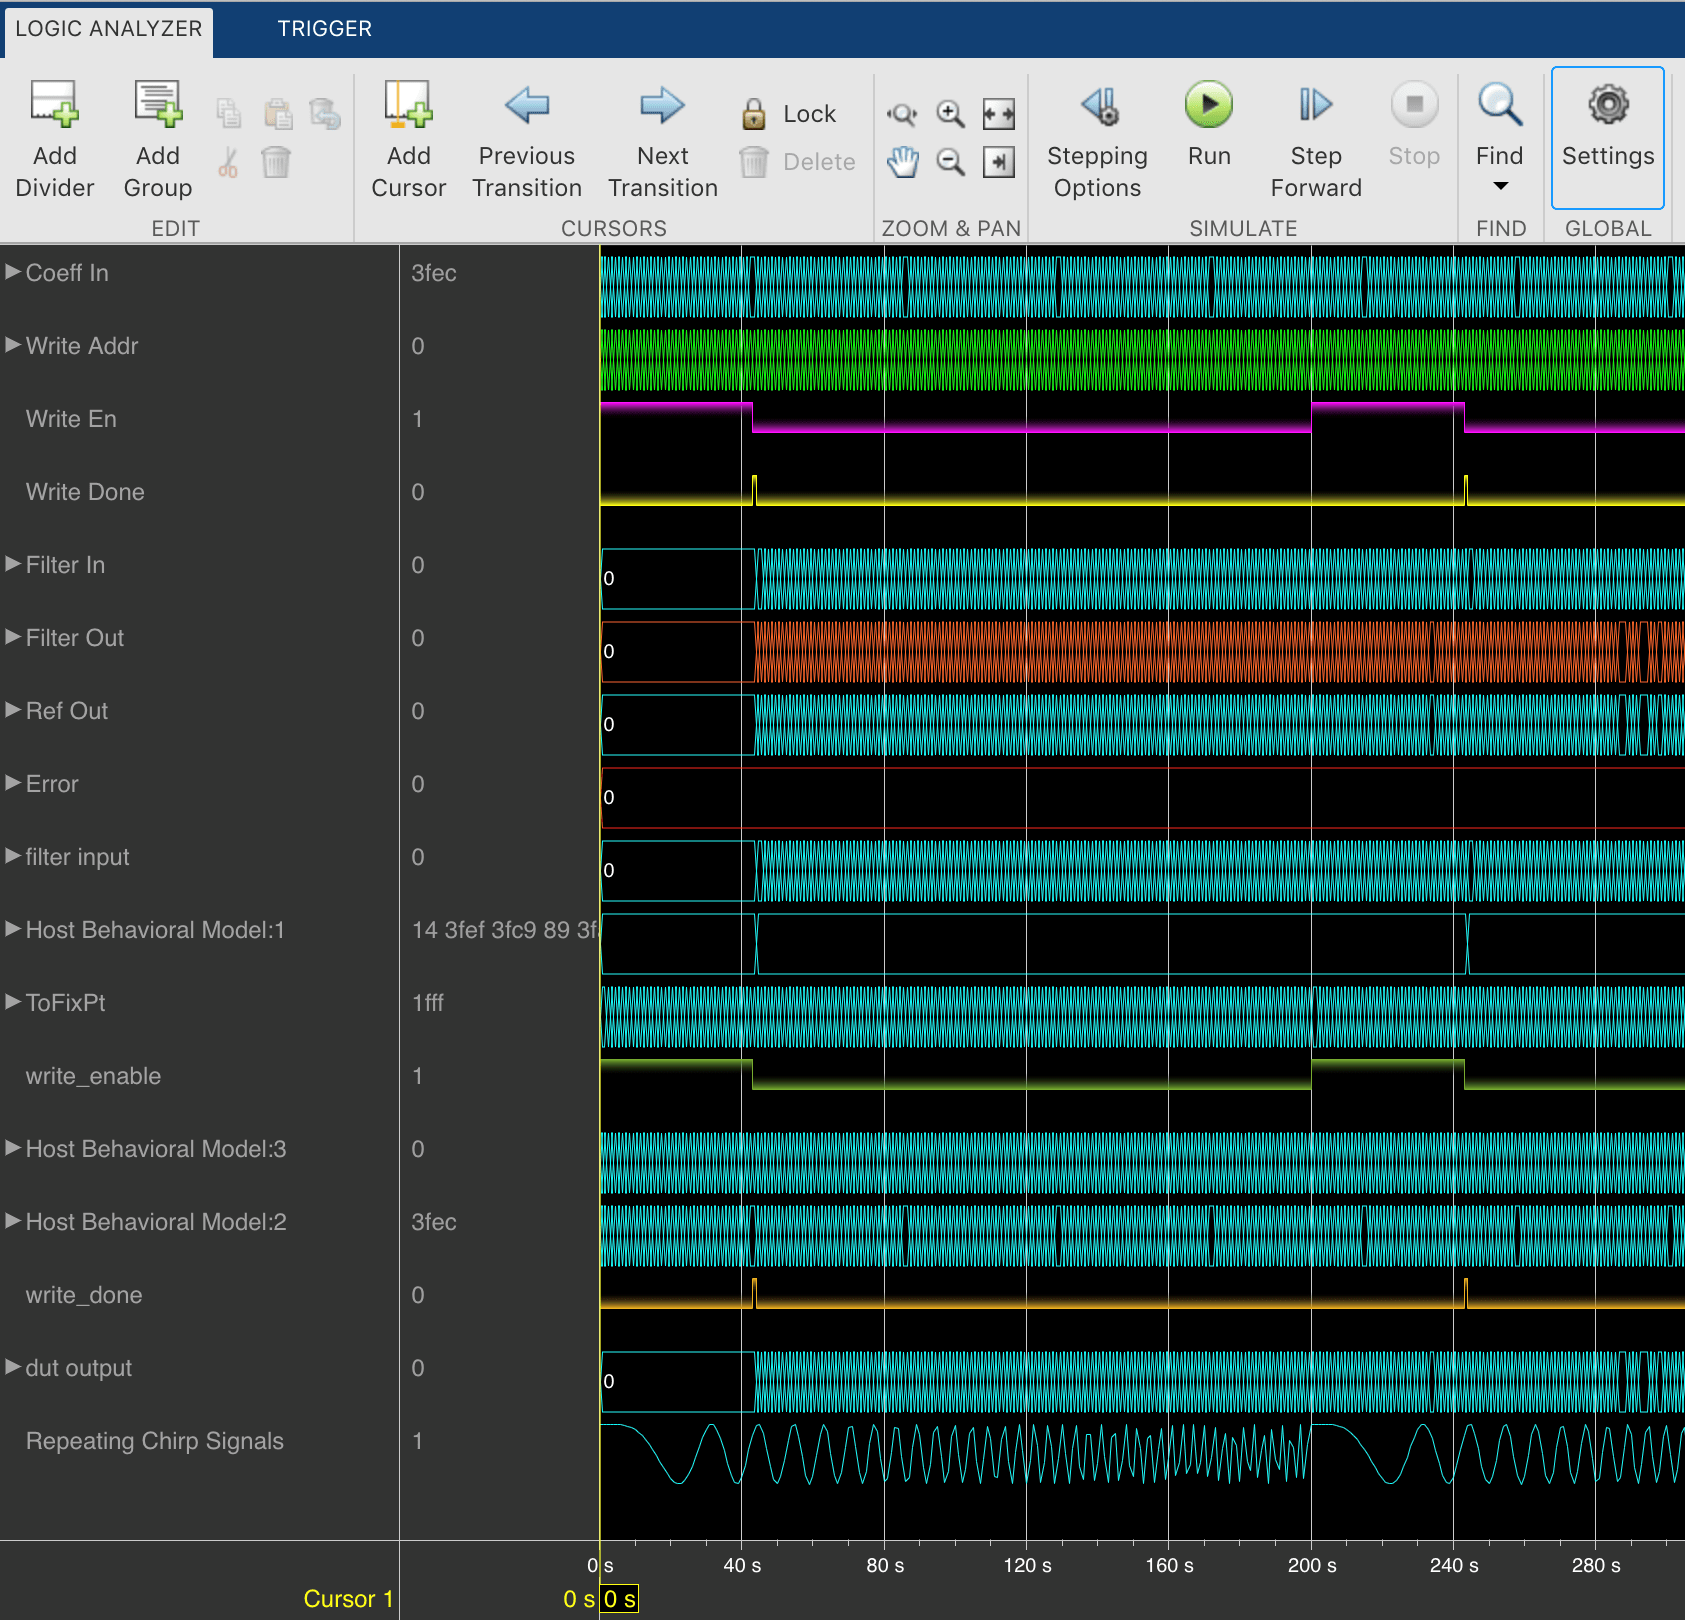
Logic Analyzer
Visualize, measure, and analyze transitions and states over time
Open the Logic Analyzer App
On the Simulink toolstrip Simulation tab, click theLogic Analyzerapp button. If the button is not displayed, expand the review results app gallery. Your most recent choice for data visualization is saved across Simulink sessions.
To visualize referenced models, you must open the Logic Analyzer from the referenced model. You should see the name of the referenced model in the Logic Analyzer toolbar.
Examples
Select Signals to Analyze
TheLogic Analyzersupports several methods for selecting data to visualize.
Select a signal in your model. When you select a signal, an ellipsis appears above the signal line. Hover over the ellipsis to view options and then select theEnable Data Loggingoption.

Right-click a signal in your model to open an options dialog box. Select theLog Selected Signalsoption.

Use any method to select multiple signal lines in your model. For example, useShift+click to select multiple lines individually orCTRL+Ato select all lines at once. Then, on theSignaltab, select theLog Signalsbutton.


To visualize data in the Logic Analyzer, you must enable signal logging for the model. (Logging is on by default.) To enable signal logging, openModel Settingsfrom the toolstrip, navigate to theData Import/Exportpane, and selectSignal logging.
When you open theLogic Analyzer, all signals marked for logging are listed. You can add and delete waves from yourLogic Analyzerwhile it is open. Adding and deleting signals does not disable logging, only removes the signal from the Logic Analyzer.
Modify Global Settings
Open theLogic Analyzerand selectSettingsfrom the toolstrip. A global settings dialog box opens. Any setting you change for an individual signal supersedes the global setting. The Logic Analyzer saves any setting changes with the model (Simulink) or System object™ (MATLAB®).

Set the displayRadixof your signals as one of the following:
Hexadecimal— Displays values as symbols from zero to nine and A to FOctal— Displays values as numbers from zero to sevenBinary— Displays values as zeros and onesSigned decimal— Displays the signed, stored integer valueUnsigned decimal— Displays the stored integer value
Set the displayFormatas one of the following:
Automatic— Displays floating point signals inAnalogformat and integer and fixed-point signals inDigitalformat. Boolean signals are displayed as zero or one.Analog— Displays values as an analog plotDigital— Displays values as digital transitions
Set the displayTime Unitsto one of the following:
Automatic— Uses a time scale appropriate to the time range shown in the current plotsecondsmillisecondsmicrosecondsnanosecondspicosecondsfemtoseconds
Set theBoolean Highlightingto one of the following:
NoneRows— Adds a highlighted background for the entire Boolean signal row.
SelectHighlight boolean valuesto add highlighting to Boolean signals.
Gradient— Adds color highlighting to Boolean signals based on value. If the signal value istrue,highlight fades out below. If the signal value isfalse,signal fades out above. With this option, you can visually deduce the value of the signal.


Inspect the graphic for an explanation of the global settings:Wave Color,Axes Color,Height,Font Size, andSpacing.Font Sizeapplies only to the text within the axes.

By default, when your simulation stops, the Logic Analyzer shows all the data for the simulation time on one screen. If you do not want this behavior, clearFit to view at Stop. This option is disabled for long simulation times.
To display the short names of waves without path information, selectDisplay short wave names.
You can expand fixed-point and integer signals and view individual bits. TheDisplay Least Significant bit firstoption enables you to reverse the order of the displayed bits.
If you stream logged bus signals to the Logic Analyzer, you can display the names of the signals inside the bus using theDisplay bus element namesoption. To show bus element names:
Add the bus signal for logging.
In the Logic Analyzer settings, select theDisplay bus element namescheck box.
Run the simulation.
When you expand the bus signals, you will see the bus signal names.

Some special situations:
If the signal has no name, the Logic Analyzer shows the block name instead.
If the bus is a bus object, the Logic Analyzer shows the bus element names specified in the Bus Object Editor.
If one of the bus elements contains an array, each element of the array is appended with the element index.

If a bus element contains an array with complex elements, the real and complex values (
i) are split.
Bus signals passed through aGainblock are labeled
Gain(1),Gain(2),...Gain(n).If the bus contains an array of buses, the Logic Analyzer prepends the element name with the bus array index.


Modify Individual Wave Settings
Open theLogic Analyzerand select a wave by double-clicking the wave name. Then from theWavetab, set parameters specific to the individual wave you selected. Any setting made on individual signals supersedes the global setting. To return individual wave parameters to the global settings, clickReset.

删除and Restore Waves
Open theLogic Analyzerand select a wave by clicking the wave name.

From theLogic Analyzertoolstrip, click
 . The wave is removed from theLogic Analyzer.
To restore the wave, from theLogic Analyzertoolstrip, click
 .
.A divider namedRestored Wavesis added to the bottom of your channels, with all deleted waves placed below it.


Add Trigger
TheLogic Analyzertrigger allows you to find data points based on certain conditions. This feature is useful for debugging or testing when you need to find a specific signal change.
Open theLogic Analyzerand select theTriggertab.

To attach a signal to the trigger, selectAttach Signals,n select the signal you want to trigger on. You can attach up to 20 signals to the trigger. Each signal can have only one triggering condition.
默认情况下,触发寻找上升的边缘the attached signals. You can set the trigger to look for rising or falling edges, bit sequences, or a comparison value. To change the triggering conditions, selectSet Conditions.
If you add multiple signals to the trigger, control the trigger logic using theOperatoroption:
AND- match all conditions.OR- match any condition.
To control how many samples you see before triggering, set theDisplay Samplesoption. For example, if you set this option to
500,Logic Analyzertries to give you 500 samples before the trigger. Depending on the simulation, theLogic Analyzermay show more or fewer than 500 samples before the trigger. However, if the trigger is found before the 500th sample, the Logic Analyzer still shows the trigger.Control the trigger mode using显示模式.
Once- TheLogic Analyzermarks only the first location matching the trigger conditions and stops showing updates to the Logic Analyzer. If you want to reset the trigger, selectRearm Trigger. Relative to the current simulation time, theLogic Analyzershows the next matching trigger event.Auto- TheLogic Analyzermarks every location matching the trigger conditions.
Before running the simulation, selectEnable Trigger. A blue cursor appears as time 0. Then, run the simulation. When a trigger is found, theLogic Analyzermarks the location with a locked blue cursor.

View Bit-Expanded Wave and Reverse Display Order of Bits
TheLogic Analyzerenables you to bit-expand fixed-point and integer waves.

In theLogic Analyzer, click the arrow next to a fixed-point or integer wave to view the bits.
The least significant bit and the most significant bit are marked withlsbandmsbnext to the wave names.

Click Settings, and then selectDisplay Least Significant bit firstto reverse the order of the displayed bits.


Related Examples
- Programmable FIR Filter for FPGA(HDL Coder)
- Packet-Based ADS-B Transceiver
- Log Simulation Output for States and Data(Stateflow)
- View Stateflow States in the Logic Analyzer(Stateflow)
Limitations
Logging Settings
If you enable the configuration parameterLog Dataset data to file, you cannot stream logged data to theLogic Analyzer.
Signals marked for logging using
Simulink.sdi.markSignalForStreamingor visualized with aDashboard Scopedo not appear on theLogic Analyzer.You cannot visualizeData Store Memoryblock signals in theLogic Analyzerif you set theLog data store dataparameter to on.
Input Signal Limitations
Signals marked for logging for theLogic Analyzermust have fewer than 8000 samples per simulation step.
TheLogic Analyzerdoes not support frame-based processing.
For 64-bit integers and fixed-point numbers greater than 53 bits, if the numbers are greater than the maximum value of double precision, the transitions between numbers might not display correctly.
You may see performance degradation in theLogic Analyzerfor large matrices (greater than 500 elements) and buses with more than 1000 signals.
TheLogic Analyzerdoes not support Stateflow data output.
Graphical Settings
While the simulation is running, you cannot zoom, pan, or modify the trigger.
To visualize constant signals, in the settings, you must set theFormatto
Digital. Constants marked for logging are visualized as a continuous transition.
| Mode | Supported | Notes and Limitations |
|---|---|---|
Normal |
Yes |
|
Accelerator |
Yes |
You cannot use theLogic Analyzerto visualize signals inModelblocks withSimulation modeset to |
Rapid Accelerator |
Yes |
Data is not available in theLogic Analyzerduring simulation. If you simulate a model with the simulation mode set to rapid accelerator, after simulation the following signals cannot be visualized in theLogic Analyzer:
|
Processor-in-the-loop (PIL) |
No |
|
Software-in-the-loop (SIL) |
No |
|
External |
No |
For more information about these modes, seeHow Acceleration Modes Work.
Select a Web Site
Choose a web site to get translated content where available and see local events and offers. Based on your location, we recommend that you select:.
Selectweb siteYou can also select a web site from the following list:
Americas
- América Latina(Español)
- Canada(English)
- United States(English)
Europe
- Belgium(English)
- Denmark(English)
- Deutschland(Deutsch)
- España(Español)
- Finland(English)
- France(Français)
- Ireland(English)
- Italia(Italiano)
- Luxembourg(English)
- Netherlands(English)
- Norway(English)
- Österreich(Deutsch)
- Portugal(English)
- Sweden(English)
- Switzerland
- United Kingdom(English)