使用简称ANFIS预测混沌时间序列
这个例子展示了如何使用简称ANFIS混沌时间序列的预测。
时间序列数据
这个示例使用简称anfis后生成的预测时间序列Mackey-Glass (MG)时滞微分方程。
这个时间序列是混乱的,没有明确的时期。系列不收敛或发散,轨迹是高度敏感的初始条件。这个基准测试问题是用于神经网络和模糊建模研究社区。
在整数点获取时间序列值,四阶龙格-库塔方法被用来找到前面的MG方程的数值解。这是假设<年代pan class="inlineequation">
,<年代pan class="inlineequation">
,<年代pan class="inlineequation">
为<年代pan class="inlineequation">
。结果保存在文件中mgdata.dat。
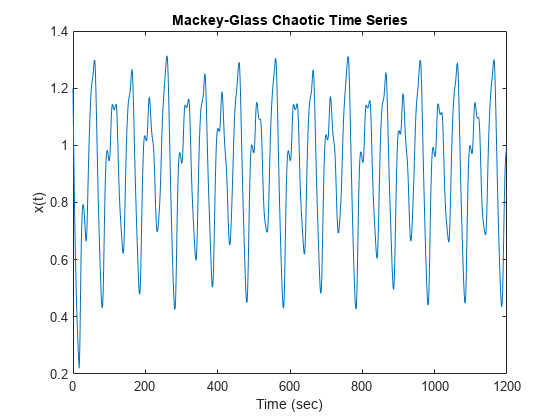
加载和绘制MG时间序列。
负载<年代pan style="color:#A020F0">mgdata.dat时间= mgdata (: 1);x = mgdata (:, 2);图(1)图(时间,x)标题(<年代pan style="color:#A020F0">Mackey-Glass混沌时间序列的)包含(<年代pan style="color:#A020F0">的时间(秒))ylabel (<年代pan style="color:#A020F0">“x (t)”)
数据进行预处理
在时间序列预测中,您使用的已知值时间序列的时间点,<年代pan class="inlineequation">
,预测在将来的某个时候,<年代pan class="inlineequation">
。这种类型的预测的标准方法是创建一个映射<年代pan class="inlineequation">
样品数据点,每个采样<年代pan class="inlineequation">
单位时间(<年代pan class="inlineequation">
)来预测未来值<年代pan class="inlineequation">
。在时间序列预测的常规设置毫克,集<年代pan class="inlineequation">
和<年代pan class="inlineequation">
。为每一个<年代pan class="inlineequation">
输入训练数据简称anfis下面是一个四柱向量形式。
输出训练数据对应的轨迹预测。
为每一个<年代pan class="inlineequation">
,价值从118年到1117年,有1000个输入/输出训练样本。对于这个示例,使用第一个500个样本作为训练数据(trnData)和第二个500值作为检测数据进行验证(chkData)。培训和检查数据数组的每一行包含一个样本点,第一个四列包含四维输入<年代pan class="inlineequation">
第五列输出<年代pan class="inlineequation">
。
构建培训和检查数据数组。
为t = 118:1117数据(t - 117:) =((根据18)x (t-12) x (t-6) x (t) x (t + 6)];<年代pan style="color:#0000FF">结束trnData =数据(1:50 0:);chkData =数据(501年:,);
构建初始模糊系统
创建一个初始Sugeno FIS对象使用的培训genfis函数与网格划分。
fis = genfis (trnData (: 1: end-1), trnData(:,结束),<年代pan style="color:#0000FF">…genfisOptions (<年代pan style="color:#A020F0">“GridPartition”));
FIS的数量输入和输出对应的列数的输入和输出训练数据,分别四个和一个。
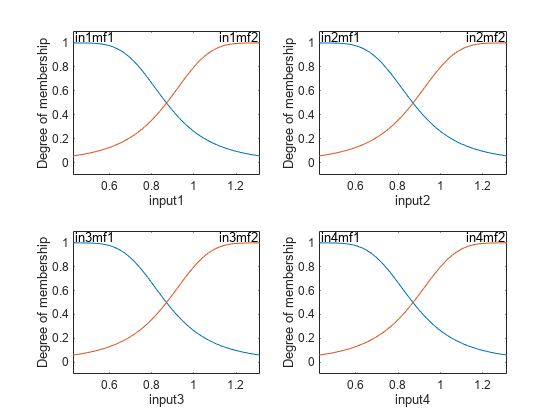
默认情况下,genfis创建两个广义贝尔隶属度函数为每个四个输入。每个变量的初始隶属度函数是等距的,覆盖整个输入空间。
图次要情节(2 2 1)plotmf (fis,<年代pan style="color:#A020F0">“输入”1)次要情节(2,2,2)plotmf (fis,<年代pan style="color:#A020F0">“输入”,2)次要情节(2,2,3)plotmf (fis,<年代pan style="color:#A020F0">“输入”3)次要情节(2,2,4)plotmf (fis,<年代pan style="color:#A020F0">“输入”4)
生成的FIS对象包含<年代pan class="inlineequation"> 与104年= 16个模糊规则参数(80年24非线性参数和线性参数)。为了达到良好的泛化能力,是很重要的,训练数据点是几倍数量的参数估计。在这种情况下,数据和参数之间的比例大约是5(500/104),这是一个很好的拟合参数和训练样本点之间的平衡。
简称ANFIS训练模型
配置训练选项,创建一个anfisOptions选项设置,指定初始FIS和验证数据。
选择= anfisOptions (<年代pan style="color:#A020F0">“InitialFIS”金融中间人,<年代pan style="color:#A020F0">“ValidationData”,chkData);
训练FIS使用指定的训练数据和选项。
[fis1, error1,党卫军,fis2, error2] =简称anfis (trnData、期权);
简称ANFIS信息:节点数:55的线性参数:80数量的非线性参数:24的参数:总数104训练数据对数量:500数量的检查数据对:500的模糊规则数量:16岁开始训练简称ANFIS……1 0.00281544 0.00285048 0.00296046 0.00290346 - 0.0028684 0.00292488 - 2 3 4 0.00280117 - 0.00276566步长增加到0.011000后时代5。5 8 7 6 0.00275517 - 0.00271874 0.00271214 - 0.00267438 0.00266783 - 0.00262818 0.00262626 - 0.00258435步长增加到0.012100后时代9。九0.00258702 - 0.00254254十0.00254972 - 0.00250247数量达到指定的时代。简称ANFIS训练完成时代10。最小的训练RMSE RMSE = 0.00250247 = 0.00254972最小的检查
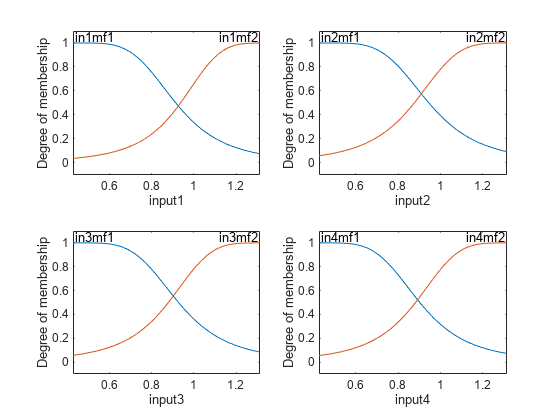
fis1培训是训练有素的模糊推理系统训练误差最小的时代。因为你指定的验证数据,误差最小的模糊系统检查,fis2也回来了。最小的FIS检查错误显示了训练数据之外的最好的概括。
情节的隶属度函数训练系统。
图次要情节(2 2 1)plotmf (fis2,<年代pan style="color:#A020F0">“输入”1)次要情节(2,2,2)plotmf (fis2,<年代pan style="color:#A020F0">“输入”,2)次要情节(2,2,3)plotmf (fis2,<年代pan style="color:#A020F0">“输入”3)次要情节(2,2,4)plotmf (fis2,<年代pan style="color:#A020F0">“输入”4)
情节误差曲线
情节的培训和检查错误信号。
图绘制([error1 error2])<年代pan style="color:#A020F0">在情节([error1 error2),<年代pan style="color:#A020F0">“o”)传说(<年代pan style="color:#A020F0">“训练误差”,<年代pan style="color:#A020F0">检查错误的)包含(<年代pan style="color:#A020F0">“时代”)ylabel (<年代pan style="color:#A020F0">“根均方误差”)标题(<年代pan style="color:#A020F0">的误差曲线)
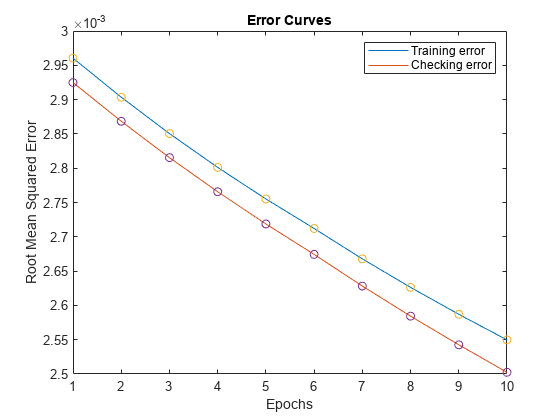
训练误差高于检查错误在所有时代。这种现象并不少见,简称ANFIS学习或者非线性回归;这可能表明,额外的培训可能会产生更好的结果。
比较原始和预测系列
检查训练系统的预测能力,评价模糊系统使用培训和检查数据,和策划结果与原始
anfis_output = evalfis (fis2, [trnData (:, 1:4);chkData (: 1:4)]);图指数= 125:1124;情节(时间(指数),[x(指数)anfis_output])包含(<年代pan style="color:#A020F0">的时间(秒))标题(<年代pan style="color:#A020F0">“毫克时间序列和简称ANFIS预测”)

预测系列类似于原始的系列。
计算并绘制预测误差。
diff = x(指数)- anfis_output;情节(时间(索引),diff)包含(<年代pan style="color:#A020F0">的时间(秒))标题(<年代pan style="color:#A020F0">预测错误的)
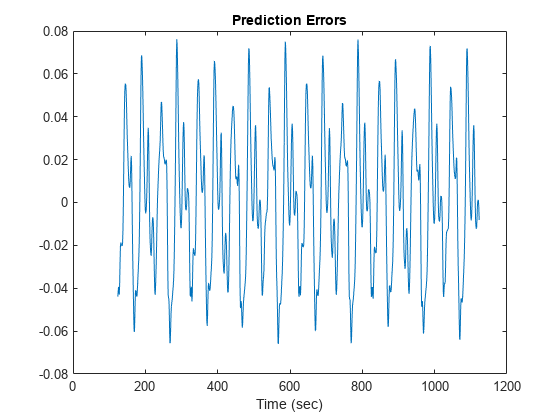
的规模预测错误情节是关于时间序列图的规模的100。在本例中,您只训练系统10时代。培训更多的时代可以提高训练的结果。
另请参阅
简称anfis|<年代pan itemscope itemtype="//www.tianjin-qmedu.com/help/schema/MathWorksDocPage/SeeAlso" itemprop="seealso">genfis|<年代pan itemscope itemtype="//www.tianjin-qmedu.com/help/schema/MathWorksDocPage/SeeAlso" itemprop="seealso">evalfis
相关的话题
你也可以从下面的列表中选择一个网站: