Main Content

fsulaplacian

Rank features for unsupervised learning using Laplacian scores

Description

example

idx= fsulaplacian(X)ranks features (variables) inXusing theLaplacian scores. The function returnsidx, which contains the indices of features ordered by feature importance. You can useidxto select important features for unsupervised learning.

example

idx= fsulaplacian(X,Name,Value)specifies additional options using one or more name-value pair arguments. For example, you can specify'NumNeighbors',10创建一个similarity graphusing 10 nearest neighbors.

[idx,scores] = fsulaplacian(___)also returns the feature scoresscores, using any of the input argument combinations in the previous syntaxes. A large score value indicates that the corresponding feature is important.

Examples

collapse all

Load the sample data.

loadionosphere

Rank the features based on importance.

[idx,scores] = fsulaplacian(X);

Create a bar plot of the feature importance scores.

bar(scores(idx)) xlabel('Feature rank') ylabel('Feature importance score')

Figure contains an axes object. The axes object contains an object of type bar.

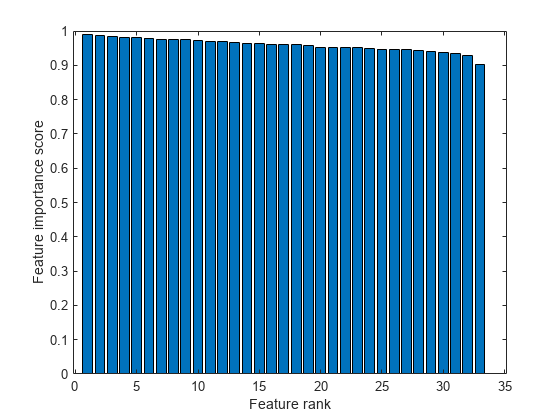
Select the top five most important features. Find the columns of these features inX.

idx(1:5)
ans =1×515 13 17 21 19

The 15th column ofXis the most important feature.

Compute a similarity matrix from Fisher's iris data set and rank the features using the similarity matrix.

Load Fisher's iris data set.

loadfisheriris

Find the distance between each pair of observations inmeasby using thepdistandsquareformfunctions with the default Euclidean distance metric.

D = pdist(meas); Z = squareform(D);

Construct the similarity matrix and confirm that it is symmetric.

S = exp(-Z.^2); issymmetric(S)
ans =logical1

Rank the features.

idx = fsulaplacian(meas,'Similarity',S)
idx =1×43 4 1 2

Ranking using the similarity matrixSis the same as ranking by specifying'NumNeighbors'assize(meas,1).

idx2 = fsulaplacian(meas,'NumNeighbors',size(meas,1))
idx2 =1×43 4 1 2

Input Arguments

collapse all

Input data, specified as ann-by-pnumeric matrix. The rows ofXcorrespond to observations (or points), and the columns correspond to features.

The software treatsNaNs inXas missing data and ignores any row ofXcontaining at least oneNaN.

Data Types:single|double

Name-Value Arguments

Specify optional pairs of arguments asName1=Value1,...,NameN=ValueN, whereNameis the argument name andValueis the corresponding value. Name-value arguments must appear after other arguments, but the order of the pairs does not matter.

Before R2021a, use commas to separate each name and value, and encloseNamein quotes.

Example:'NumNeighbors',10,'KernelScale','auto'specifies the number of nearest neighbors as 10 and the kernel scale factor as'auto'.

Similarity matrix, specified as the comma-separated pair consisting of'Similarity'and ann-by-nsymmetric matrix, wherenis the number of observations. The similarity matrix (or adjacency matrix) represents the input data by modeling local neighborhood relationships among the data points. The values in a similarity matrix represent the edges (or connections) between nodes (data points) that are connected in asimilarity graph. For more information, seeSimilarity Matrix.

如果您指定the'Similarity'value, then you cannot specify any other name-value pair argument. If you do not specify the'Similarity'value, then the software computes a similarity matrix using the options specified by the other name-value pair arguments.

Data Types:single|double

Distance metric, specified as the comma-separated pair consisting of'Distance'and a character vector, string scalar, or function handle, as described in this table.

Value Description
'euclidean'

Euclidean distance (default)

'seuclidean'

Standardized Euclidean distance. Each coordinate difference between observations is scaled by dividing by the corresponding element of the standard deviation computed fromX. Use theScalename-value pair argument to specify a different scaling factor.

'mahalanobis'

Mahalanobis distance using the sample covariance ofX,C = cov(X,'omitrows'). Use theCovname-value pair argument to specify a different covariance matrix.

'cityblock'

City block distance

'minkowski'

闵可夫斯基距离。default exponent is 2. Use thePname-value pair argument to specify a different exponent, wherePis a positive scalar value.

'chebychev'

Chebychev distance (maximum coordinate difference)

'cosine'

One minus the cosine of the included angle between observations (treated as vectors)

'correlation'

One minus the sample correlation between observations (treated as sequences of values)

'hamming'

Hamming distance, which is the percentage of coordinates that differ

“jaccard”

One minus the Jaccard coefficient, which is the percentage of nonzero coordinates that differ

'spearman'

One minus the sample Spearman's rank correlation between observations (treated as sequences of values)

@distfun

Custom distance function handle. A distance function has the form

functionD2 = distfun(ZI,ZJ)% calculation of distance...
where

  • ZIis a1-by-nvector containing a single observation.

  • ZJis anm2-by-nmatrix containing multiple observations.distfunmust accept a matrixZJwith an arbitrary number of observations.

  • D2is anm2-by-1vector of distances, andD2(k)is the distance between observationsZIandZJ(k,:).

If your data is not sparse, you can generally compute distance more quickly by using a built-in distance instead of a function handle.

For more information, seeDistance Metrics.

When you use the'seuclidean','minkowski', or'mahalanobis'distance metric, you can specify the additional name-value pair argument'Scale','P', or'Cov', respectively, to control the distance metrics.

Example:'Distance','minkowski','P',3specifies to use the Minkowski distance metric with an exponent of3.

Exponent for the Minkowski distance metric, specified as the comma-separated pair consisting of'P'and a positive scalar.

This argument is valid only if'Distance'is'minkowski'.

Example:'P',3

Data Types:single|double

Covariance matrix for the Mahalanobis distance metric, specified as the comma-separated pair consisting of'Cov'and a positive definite matrix.

This argument is valid only if'Distance'is'mahalanobis'.

Example:'Cov',eye(4)

Data Types:single|double

Scaling factors for the standardized Euclidean distance metric, specified as the comma-separated pair consisting of'Scale'and a numeric vector of nonnegative values.

Scalehas lengthp(the number of columns inX), because each dimension (column) ofXhas a corresponding value inScale. For each dimension ofX,fsulaplacianuses the corresponding value inScaleto standardize the difference between observations.

This argument is valid only if'Distance'is'seuclidean'.

Data Types:single|double

Number of nearest neighbors used to construct the similarity graph, specified as the comma-separated pair consisting of'NumNeighbors'and a positive integer.

Example:'NumNeighbors',10

Data Types:single|double

Scale factor for the kernel, specified as the comma-separated pair consisting of'KernelScale'and'auto'or a positive scalar. The software uses the scale factor to transform distances to similarity measures. For more information, seeSimilarity Graph.

  • The'auto'option is supported only for the'euclidean'and'seuclidean'distance metrics.

  • 如果您指定'auto', then the software selects an appropriate scale factor using a heuristic procedure. This heuristic procedure uses subsampling, so estimates can vary from one call to another. To reproduce results, set a random number seed usingrngbefore callingfsulaplacian.

Example:'KernelScale','auto'

输出参数

collapse all

Indices of the features inXordered by feature importance, returned as a numeric vector. For example, ifidx(3)is5, then the third most important feature is the fifth column inX.

Feature scores, returned as a numeric vector. A large score value inscoresindicates that the corresponding feature is important. The values inscoreshave the same order as the features inX.

More About

collapse all

Similarity Graph

A similarity graph models the local neighborhood relationships between data points inXas an undirected graph. The nodes in the graph represent data points, and the edges, which are directionless, represent the connections between the data points.

If the pairwise distanceDisti,jbetween any two nodesiandjis positive (or larger than a certain threshold), then the similarity graph connects the two nodes using an edge[2]. The edge between the two nodes is weighted by the pairwise similaritySi,j, where S i , j = exp ( ( D i s t i , j σ ) 2 ) , for a specified kernel scaleσvalue.

fsulaplacianconstructs a similarity graph using the nearest neighbor method. The function connects points inXthat are nearest neighbors. Use'NumNeighbors'to specify the number of nearest neighbors.

Similarity Matrix

A similarity matrix is a matrix representation of asimilarity graph. Then-by-nmatrix S = ( S i , j ) i , j = 1 , , n contains pairwise similarity values between connected nodes in the similarity graph. The similarity matrix of a graph is also called an adjacency matrix.

The similarity matrix is symmetric because the edges of the similarity graph are directionless. A value ofSi,j= 0means that nodesiandjof the similarity graph are not connected.

Degree Matrix

A degree matrixDgis ann-by-ndiagonal matrix obtained by summing the rows of thesimilarity matrixS. That is, theith diagonal element ofDgis D g ( i , i ) = j = 1 n S i , j .

Laplacian Matrix

A Laplacian matrix, which is one way of representing asimilarity graph,定义是不同的tween thedegree matrixDgand thesimilarity matrixS.

L = D g S .

Algorithms

collapse all

Laplacian Score

Thefsulaplacianfunction ranks features using Laplacian scores[1]obtained from a nearest neighborsimilarity graph.

fsulaplaciancomputes the values inscoresas follows:

  1. For each data point inX, define a local neighborhood using the nearest neighbor method, and find pairwise distances D i s t i , j for all pointsiandjin the neighborhood.

  2. Convert the distances to thesimilarity matrixSusing the kernel transformation S i , j = exp ( ( D i s t i , j σ ) 2 ) , whereσis the scale factor for the kernel as specified by the'KernelScale'name-value pair argument.

  3. Center each feature by removing its mean.

    x ˜ r = x r x r T D g 1 1 T D g 1 1 ,

    wherexris therth feature,Dgis thedegree matrix, and 1 T = [ 1 , , 1 ] T .

  4. Compute the scoresrfor each feature.

    s r = x ˜ r T S x ˜ r x ˜ r T D g x ˜ r .

Note that[1]defines the Laplacian score as

L r = x ˜ r T L x ˜ r x ˜ r T D g x ˜ r = 1 x ˜ r T S x ˜ r x ˜ r T D g x ˜ r ,

whereLis theLaplacian matrix, defined as the difference betweenDgandS. Thefsulaplacianfunction uses only the second term of this equation for the score value ofscoresso that a large score value indicates an important feature.

Selecting features using the Laplacian score is consistent with minimizing the value

i , j ( x i r x j r ) 2 S i , j V a r ( x r ) ,

wherexirrepresents theith observation of therth feature. Minimizing this value implies that the algorithm prefers features with large variance. Also, the algorithm assumes that two data points of an important feature are close if and only if the similarity graph has an edge between the two data points.

References

[1] He, X., D. Cai, and P. Niyogi. "Laplacian Score for Feature Selection."NIPS Proceedings.2005.

[2] Von Luxburg, U. “A Tutorial on Spectral Clustering.”Statistics and Computing Journal. Vol.17, Number 4, 2007, pp. 395–416.

Version History

Introduced in R2019b