Deep Learning Visualization
Monitor training progress using built-in plots of network accuracy and loss. Investigate trained networks using visualization techniques such as Grad-CAM, occlusion sensitivity, LIME, and deep dream.
Apps
| Deep Network Designer | Design, visualize, and train deep learning networks |
Functions
Properties
| ConfusionMatrixChart Properties | Confusion matrix chart appearance and behavior |
Topics
- Classify Webcam Images Using Deep Learning
This example shows how to classify images from a webcam in real time using the pretrained deep convolutional neural network GoogLeNet.
- Monitor Deep Learning Training Progress
This example shows how to monitor the training process of deep learning networks.
- Understand Network Predictions Using Occlusion
This example shows how to use occlusion sensitivity maps to understand why a deep neural network makes a classification decision.
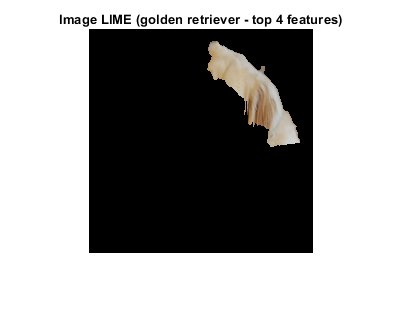
- Interpret Deep Network Predictions on Tabular Data Using LIME
This example shows how to use the locally interpretable model-agnostic explanations (LIME) technique to understand the predictions of a deep neural network classifying tabular data.
- Investigate Spectrogram Classifications Using LIME
This example shows how to use locally interpretable model-agnostic explanations (LIME) to investigate the robustness of a deep convolutional neural network trained to classify spectrograms.
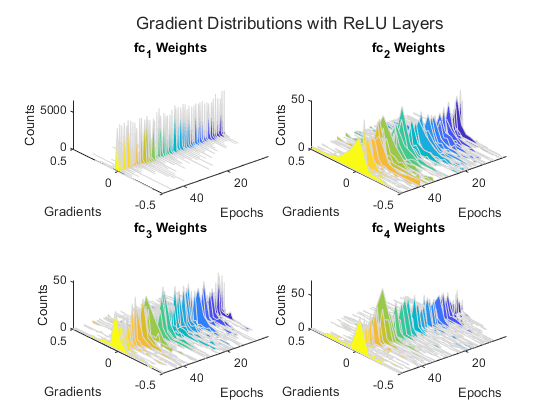
- Investigate Classification Decisions Using Gradient Attribution Techniques
This example shows how to use gradient attribution maps to investigate which parts of an image are most important for classification decisions made by a deep neural network.
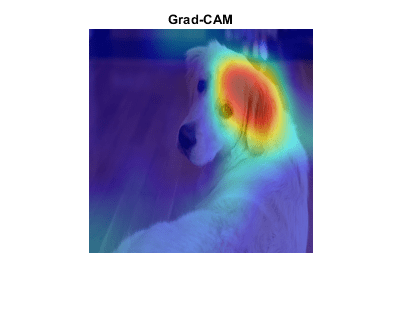
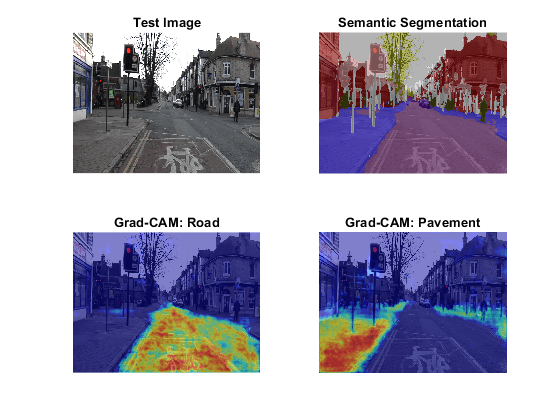
- Investigate Network Predictions Using Class Activation Mapping
This example shows how to use class activation mapping (CAM) to investigate and explain the predictions of a deep convolutional neural network for image classification.
- Visualize Image Classifications Using Maximal and Minimal Activating Images
This example shows how to use a data set to find out what activates the channels of a deep neural network.
- View Network Behavior Using tsne
This example shows how to use the
tsnefunction to view activations in a trained network. - Monitor GAN Training Progress and Identify Common Failure Modes
Learn how to diagnose and fix some of the most common failure modes in GAN training.
- Visualize Activations of a Convolutional Neural Network
This example shows how to feed an image to a convolutional neural network and display the activations of different layers of the network.
- Visualize Activations of LSTM Network
This example shows how to investigate and visualize the features learned by LSTM networks by extracting the activations.
- Visualize Features of a Convolutional Neural Network
This example shows how to visualize the features learned by convolutional neural networks.
- Deep Learning Visualization Methods
Learn about and compare deep learning visualization methods.
Featured Examples


You can also select a web site from the following list:
Americas
- América Latina(Español)
- Canada(English)
- United States(English)
Europe
- Belgium(English)
- Denmark(English)
- Deutschland(Deutsch)
- España(Español)
- Finland(English)
- France(Français)
- Ireland(English)
- Italia(Italiano)
- Luxembourg(English)
- Netherlands(English)
- Norway(English)
- Österreich(Deutsch)
- Portugal(English)
- Sweden(English)
- Switzerland
- United Kingdom(English)