在所有可能的情况下,在所有可能的情况下使用真实数据进行跟踪算法可能很困难或危险。为这些方案模拟传感器数据更安全,并允许设计师早些时候找到问题。
在此视频中,我将向您展示开始跟踪方案设计器应用程序的最简单方法。
该应用程序使您可以交互创建方案以测试您的跟踪算法,而无需编写任何代码。
Here is the workflow that we will follow
首先,我们将定义我们的平台和目标。接下来,我们将定义他们的轨迹。然后,我们将定义并将传感器添加到我们的平台和目标中。我们将模拟该方案,以确保它按照我们的预期创建,并最终生成一个与我们的跟踪算法集成的MATLAB脚本。
You can get to this app by opening the Apps section in MATLAB and find it under the Signal Processing and Communications section.
因此,让我们开始。我们将遍历设计一个简单的场景,其中有一个基于塔的雷达和两架飞机。
我们将从画布上添加塔
接下来,我们将建立我们要跟踪的两架飞机。首先,我们将放大以将飞机放到更远的地方。然后,我们将从平台菜单中选择一架平面,然后单击将其放在画布上。让我们将初始高度设置为3000m。然后,我们将从“轨迹”选项卡中设置其轨迹,然后单击以放置路点。
We will quickly do the same for our other plane. Now, watch how easy it is to adjust the trajectory of the plane. We can move the entire trajectory, and individual waypoints. We can do the same with the Time-Altitude plot, and adjust the altitude. We can see more details about the trajectory by looking at the trajectory table. This is automatically generated when creating waypoints, and can be manually changed for more control.
现在,我们将一个dd a radar to the top of the tower. Let's choose the rotator from the sensor menu, click to place it on the tower, and open up an additional view to help set the location. We want the sensor to be at an elevation of 60 meters, so we set the height to -60, because on the tower we are in the north east down coordinate system. I set the sensor to report elevation, change the scan limits to 220 and 320 degrees, and increase the field of view to be 15 degrees to expand our coverage. Note that there are many additional properties that can be set on the sensor here, but for the simplicity of this demonstration we will leave these as the default values.
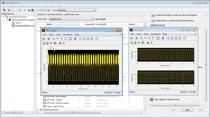
Now that we've specified our platforms and sensors, let's run the scenario. We can see the ground truth of the platforms and their trajectories, the sensors and their field of views, and the detections the sensors are generating, denoted by the small circles. We can also pause, step, and rewind the simulation here to verify that we created the scenario as intended. In addition, we can use the time scrubber at the bottom of the screen to scroll through different points in the simulation. We're happy with our scene and ready to test our tracking algorithms. Let's return to the main designer tab to export to MATLAB code.
You can see the generated code for the scenario we just created, and comments show where to add your tracker. Running the code as is will reproduce the scenario we just designed. For more information and examples on setting up trackers please refer to our documentation.
因此,总而言之,我们通过拖动平台创建了跟踪方案的模型,我们将传感器挂在平台上,模拟了对象的检测,最后我们为场景生成了代码,这些代码很容易与跟踪算法集成。
有了这些信息,您可以设计方案来测试跟踪算法。而且,如果您想了解有关我们的跟踪方案和传感器融合功能的更多信息,请访问我们的文档。