
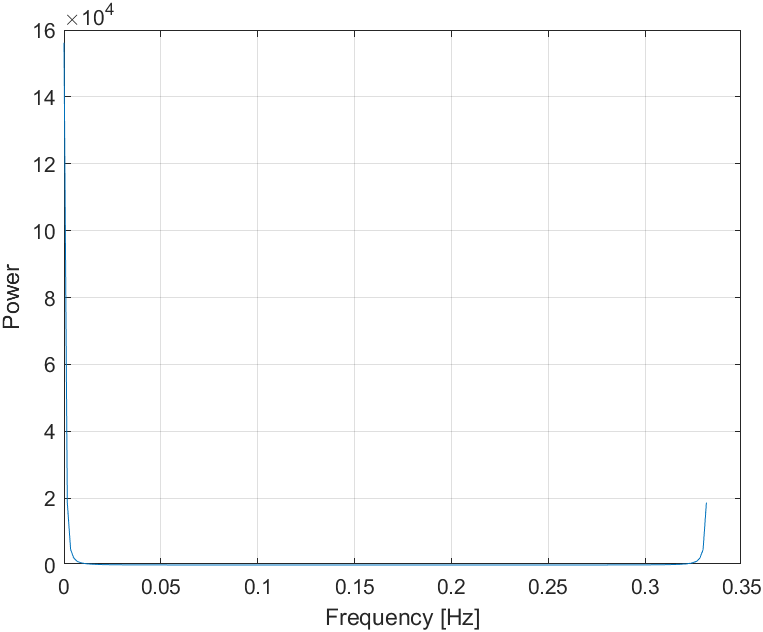
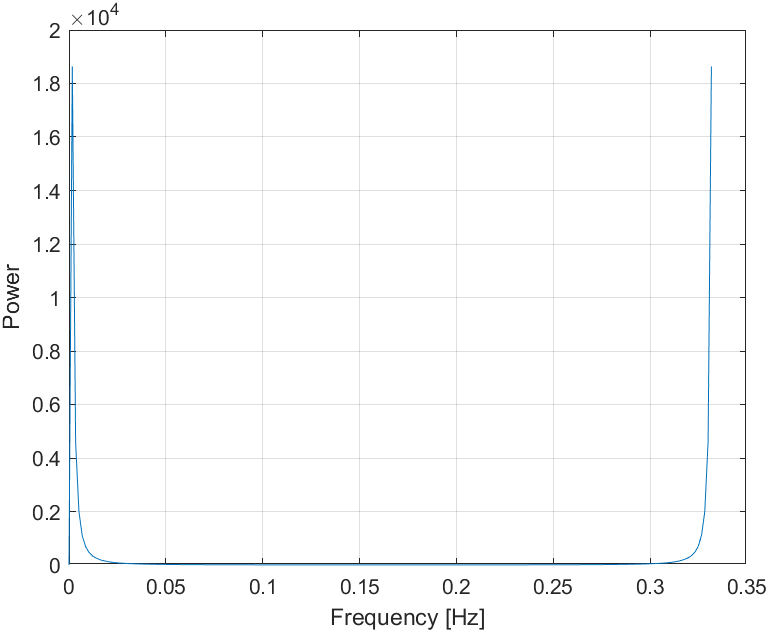
Judging from the fluctuations of your initial signal, there should be more than two frequencies present in its frequency content. Besides that, the fft functions will output a complex series of numbers, which you are plotting, and which is responsible for the symetry. I can't see how taking abs(y) helps you, since a physical signal has no such thing as negative frequency content.
And could it be that through discretization the actual value (0.316 Hz) and found value (0.3316 Hz) are slightly different?
Yes, could very well be. Might also be inaccurate clicking on the exact peak if ur using datatips to find the peak in ur plot.
This is a bit of a halfassed answer I'm sorry, but I'd recommend you to read:
https://medium.com/analytics-vidhya/breaking-down-confusions-over-fast-fourier-transform-fft-1561a029b1ab
.
Covers everything you need to know to go from a time signal to meaningful frequency analysis using the fft function in matlab. Good luck!


