Plot confidence intervals
version 1.0.0.0 (601 Bytes) by
Raymond Reynolds
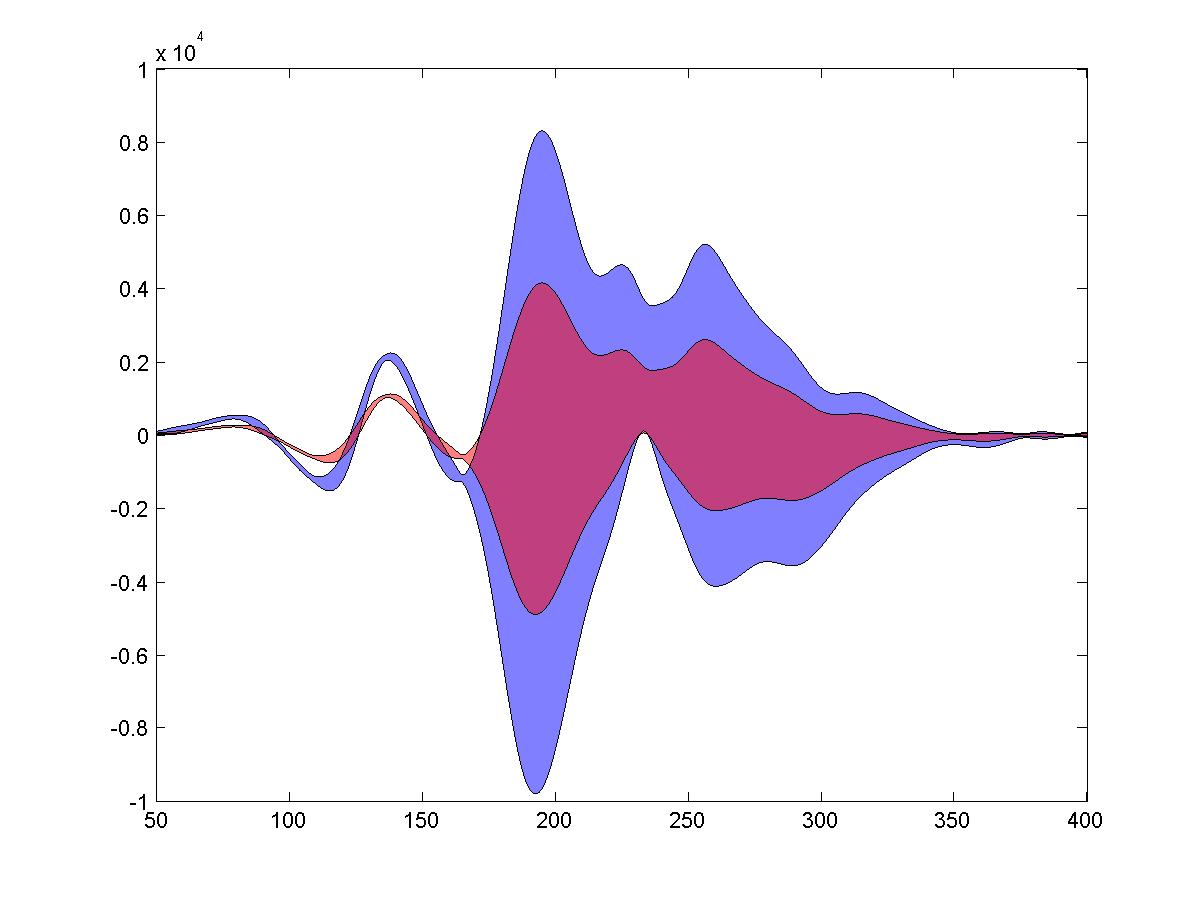
Plots a shaded region between specified lower and upper limits
16.7K Downloads
Updated27 Nov 2006
No License
Plots shaded confidence intervals. Uses the matlab fill function, rather than area. This allows for multiple confidence plots to be overlayed for statistical comparison.
Cite As
Raymond Reynolds (2022).Plot confidence intervals(//www.tianjin-qmedu.com/matlabcentral/fileexchange/13103-plot-confidence-intervals), MATLAB Central File Exchange. Retrieved.
MATLAB Release Compatibility
Created with R13
Compatible with any release
Platform Compatibility
Windows macOS LinuxCategories
Tags
Acknowledgements
Inspired:ciplot(lower,upper,x,colour,alpha)
Community Treasure Hunt
Find the treasures in MATLAB Central and discover how the community can help you!
Start Hunting!Discover Live Editor
Create scripts with code, output, and formatted text in a single executable document.