Graphics
Two- and three-dimensional plots, images, animation
Graphics functions include 2-D and 3-D plotting functions to visualize data and communicate results. Customize plots either interactively or programmatically.
Categories
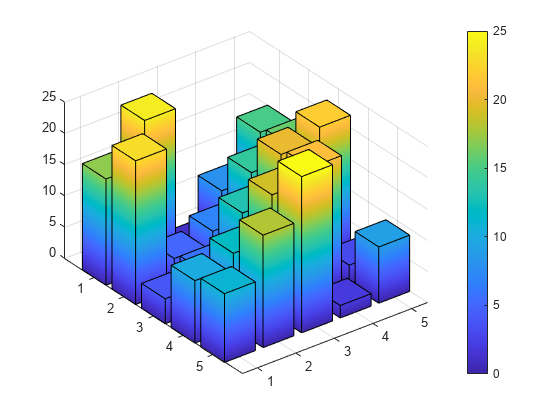
- 2-D and 3-D Plots
Plot continuous, discrete, surface, and volume data - Formatting and Annotation
Add labels, adjust colors, define axis limits, apply lighting or transparency, set camera view - Images
读、写、显示和修改图像 - Printing and Saving
Print and export to standard file formats - Graphics Objects
Customize graphics by setting properties of the underlying objects - Graphics Performance
Optimize code for improved performance
Featured Examples


You can also select a web site from the following list:
Americas
- América Latina(Español)
- Canada(English)
- United States(English)
Europe
- Belgium(English)
- Denmark(English)
- Deutschland(Deutsch)
- España(Español)
- Finland(English)
- France(Français)
- Ireland(English)
- Italia(Italiano)
- Luxembourg(English)
- Netherlands(English)
- Norway(English)
- Österreich(Deutsch)
- Portugal(English)
- Sweden(English)
- Switzerland
- United Kingdom(English)