 Cleve’s Corner: Cleve Moler on Mathematics and Computing
 The MATLAB Blog
 Steve on Image Processing with MATLAB
 Guy on Simulink
 Deep Learning
 Developer Zone
 Stuart’s MATLAB Videos
 Behind the Headlines
 File Exchange Pick of the Week
 Hans on IoT
 Student Lounge
 MATLAB Community
 MATLAB ユーザーコミュニティー
 Startups, Accelerators, & Entrepreneurs
R2020b: swarmchart
Jiro's Pick this week isswarmchart, a new visualization function in R2020b.
Following Sean'spostfrom last week, I'd like to highlight a new function fromthe newest release of MATLAB.
Many, many years ago, IPickeda File Exchange entry calledbeeswarm plot. It's a vizualization that lets you see the distribution of the data along a dimension.
data = {randn(1, 25), randn(1, 100) + 1, randn(1, 300) - 0.5}; plotSpread(data,...'xNames', {'one','two','three'},...'distributionMarkers', {'o','+','.'});

你can also see similar type of plots by searching for"violin plot".
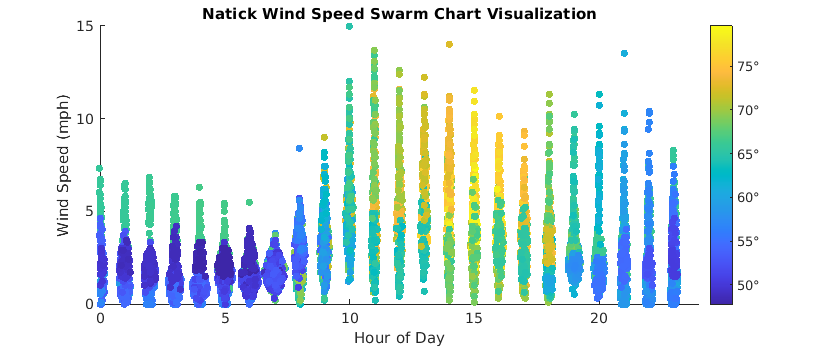
In R2020b, you can now create this type of visualization with the new functionswarmchart.
data = [data{:}]; x = categorical([ones(1,25) 2*ones(1,100) 3*ones(1,300)],[1 2 3],["one""two""three"]); clf swarmchart(x,data)

If you are on an older release of MATLAB, you can make use of the entries on File Exchange, but I recommend you upgrade to the newest release to take advantange of the plethora ofnew featuresthat come with it.
Comments
Give it a try and let us know what you thinkhere.
- Category:
- Picks


Comments
To leave a comment, please clickhereto sign in to your MathWorks Account or create a new one.