Visualize Transitions Data fortransprob
This example shows how to visualize credit rating transitions that are used as an input to thetransprobfunction. The example also describes how thetransprobfunction treats rating transitions when the company data starts after the start date of the analysis, or when the end date of the analysis is after the last transition observed.
Sample Data
Set up fictitious sample data for illustration purposes.
data = {'ABC','17-Feb-2015','AA';'ABC','6-Jul-2017','A';'LMN','12-Aug-2014','B';'LMN','9-Nov-2015','CCC';'LMN','7-Sep-2016','D';'XYZ','14-May-2013','BB';'XYZ','21-Jun-2016','BBB'}; data = cell2table(data,'VariableNames',{'ID','Date','Rating'}); disp(data)
ID Date Rating _______ _______________ _______ {'ABC'} {'17-Feb-2015'} {'AA' } {'ABC'} {'6-Jul-2017' } {'A' } {'LMN'} {'12-Aug-2014'} {'B' } {'LMN'} {'9-Nov-2015' } {'CCC'} {'LMN'} {'7-Sep-2016' } {'D' } {'XYZ'} {'14-May-2013'} {'BB' } {'XYZ'} {'21-Jun-2016'} {'BBB'}
Thetransprobfunction understands that this panel-data format indicates the dates when a new rating is assigned to a given company.transprobassumes that such ratings remain unchanged, unless a subsequent row explicitly indicates a rating change. For example, for company'ABC',transprobunderstands that the'A'rating is unchanged for any date after'6-Jul-2017'(indefinitely).
Compute Transition Matrix and Transition Counts
Thetransprobfunction returns a transition probability matrix as the primary output. There are also optional outputs that contain additional information for how many transitions occurred. For more information, seetransprobfor information on the optional outputs for both the'cohort'and the'duration'methods.
For illustration purposes, this example allows you to pick theStartYear(limited to2014or2015for this example) and theEndYear(2016or2017). This example also uses thehDisplayTransitionshelper function (see theLocal Functionssection) to format the transitions information for ease of reading.
StartYear =2014; EndYear =
2017; startDate = datetime(StartYear,12,31,'Locale','en_US'); endDate = datetime(EndYear,12,31,'Locale','en_US'); RatingLabels = ["AAA","AA","A","BBB","BB","B","CCC",“D”]; [tm,st,it] = transprob(data,'startDate',startDate,'endDate',endDate,'algorithm','cohort','labels',RatingLabels);
The transition probabilities of theTransMatoutput indicate the probability of migrating between ratings. The probabilities are expressed in %, that is, they are multiplied by 100.
hDisplayTransitions(tm,RatingLabels,"Transition Matrix")
Transition Matrix AAA AA A BBB BB B CCC D ___ __ ___ ___ __ _ ___ ___ AAA 100 0 0 0 0 0 0 0 AA 0 50 50 0 0 0 0 0 A 0 0 100 0 0 0 0 0 BBB 0 0 0 100 0 0 0 0 BB 0 0 0 50 50 0 0 0 B 0 0 0 0 0 0 100 0 CCC 0 0 0 0 0 0 0 100 D 0 0 0 0 0 0 0 100
The transition counts are stored in thesampleTotalsoptional output and indicate how many transitions occurred between ratings for the entire sample (that is, all companies).
hDisplayTransitions(st.totalsMat,RatingLabels,"Transition counts, all companies")
Transition counts, all companies AAA AA A BBB BB B CCC D ___ __ _ ___ __ _ ___ _ AAA 0 0 0 0 0 0 0 0 AA 0 1 1 0 0 0 0 0 A 0 0 0 0 0 0 0 0 BBB 0 0 0 1 0 0 0 0 BB 0 0 0 1 1 0 0 0 B 0 0 0 0 0 0 1 0 CCC 0 0 0 0 0 0 0 1 D 0 0 0 0 0 0 0 1
The third output oftransprobisidTotalsthat contains information about transitions at an ID level, company by company (in the same order that the companies appear in the input data).
Select a company to display the transition counts and a corresponding visualization of the transitions. ThehPlotTransitionshelper function (see theLocal Functionssection) shows the transitions history for a company.
CompanyID ="ABC"; UniqueIDs = unique(data.ID,'stable'); [~,CompanyIndex] = ismember(CompanyID,UniqueIDs); hDisplayTransitions(it(CompanyIndex).totalsMat,RatingLabels,strcat("Transition counts, company ID: ",CompanyID))
Transition counts, company ID: ABC AAA AA A BBB BB B CCC D ___ __ _ ___ __ _ ___ _ AAA 0 0 0 0 0 0 0 0 AA 0 1 1 0 0 0 0 0 A 0 0 0 0 0 0 0 0 BBB 0 0 0 0 0 0 0 0 BB 0 0 0 0 0 0 0 0 B 0 0 0 0 0 0 0 0 CCC 0 0 0 0 0 0 0 0 D 0 0 0 0 0 0 0 0
hPlotTransitions(CompanyID,startDate,endDate,data,RatingLabels)
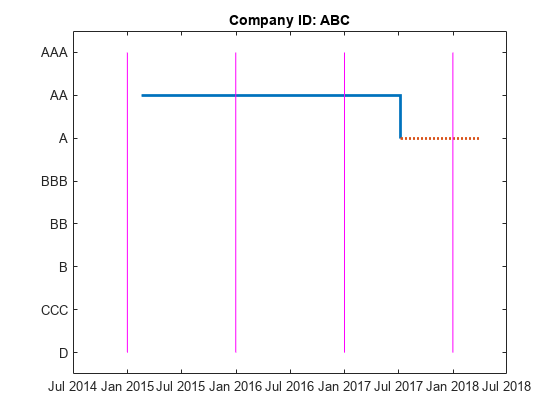
To understand howtransprobhandles data when the first observed date is after the start date of the analysis, or whose last observed date occurs before the end date of the analysis, consider the following example. For company'ABC'suppose that the analysis has a start date of31-Dec-2014and end date of31-Dec-2017. There are only two transitions reported for this company for that analysis time window. The first observation for'ABC'happened on17-Feb-2015. So the31-Dec-2015snapshot is the first time the company is observed. By31-Dec-2016, the company remained in the original'AA'rating. By31-Dec-2017, a downgrade to'A'is recorded. Consistent with this, the transition counts show one transition from'AA'to'AA'(from the end of 2015 to the end of 2016), and one transition from'AA'to'A'(从2016年底到2017年底). The plot shows the last rating as a dotted red line to emphasize that the last rating in the data is extrapolated indefinitely into the future. There is no extrapolation into the past; the company's history is ignored until a company rating is known for an entire transition period (31-Dec-2015through31-Dec-2016in the case of'ABC').
Compute Transition Matrix ContainingNR(Not Rated) Rating
Consider a different sample data containing only a single company'DEF'. The data contains transitions of company'DEF'from'A'to'NR'rating and a subsequent transition from'NR'to'BBB'.
dataNR = {'DEF','17-Mar-2011','A';'DEF','24-Mar-2014','NR';'DEF','26-Sep-2016','BBB'}; dataNR = cell2table(dataNR,'VariableNames',{'ID','Date','Rating'}); disp(dataNR)
ID Date Rating _______ _______________ _______ {'DEF'} {'17-Mar-2011'} {'A' } {'DEF'} {'24-Mar-2014'} {'NR' } {'DEF'} {'26-Sep-2016'} {'BBB'}
transprobtreats'NR'as another rating. The transition matrix below shows the estimated probability of transitioning into and out of'NR'.
StartYearNR = 2010; EndYearNR = 2018; startDateNR = datetime(StartYearNR,12,31,'Locale','en_US'); endDateNR = datetime(EndYearNR,12,31,'Locale','en_US'); CompanyID_NR =“DEF”; RatingLabelsNR = ["AAA","AA","A","BBB","BB","B","CCC",“D”,"NR"]; [tmNR,~,itNR] = transprob(dataNR,'startDate',startDateNR,'endDate',endDateNR,'algorithm','cohort','labels',RatingLabelsNR); hDisplayTransitions(tmNR,RatingLabelsNR,"Transition Matrix")
过渡矩阵AAA AA BBB BB B CCC D NR ___ ___ ______ ___ ___ ___ ___ ___ ______ AAA 100 0 0 0 0 0 0 0 0 AA 0 100 0 0 0 0 0 0 0 A 0 0 66.667 0 0 0 0 0 33.333 BBB 0 0 0 100 0 0 0 0 0 BB 0 0 0 0 100 0 0 0 0 B 0 0 0 0 0 100 0 0 0 CCC 0 0 0 0 0 0 100 0 0 D 0 0 0 0 0 0 0 100 0 NR 0 0 0 50 0 0 0 0 50
Display the transition counts and corresponding visualization of the transitions.
hDisplayTransitions(itNR.totalsMat,RatingLabelsNR,strcat("Transition counts, company ID: ",CompanyID_NR))
Transition counts, company ID: DEF AAA AA A BBB BB B CCC D NR ___ __ _ ___ __ _ ___ _ __ AAA 0 0 0 0 0 0 0 0 0 AA 0 0 0 0 0 0 0 0 0 A 0 0 2 0 0 0 0 0 1 BBB 0 0 0 2 0 0 0 0 0 BB 0 0 0 0 0 0 0 0 0 B 0 0 0 0 0 0 0 0 0 CCC 0 0 0 0 0 0 0 0 0 D 0 0 0 0 0 0 0 0 0 NR 0 0 0 1 0 0 0 0 1
hPlotTransitions(CompanyID_NR,startDateNR,endDateNR,dataNR,RatingLabelsNR)
To remove the'NR'from the transition matrix, use the'excludeLabels'name-value input argument intransprob. The list of labels to exclude may or may not be specified in the name-value pair argumentlabels. For example, bothRatingLabelsandRatingLabelsNRgenerate the same output fromtransprob.
[tmNR,stNR,itNR] = transprob(dataNR,'startDate',startDateNR,'endDate',endDateNR,'algorithm','cohort','labels',RatingLabelsNR,'excludeLabels','NR'); hDisplayTransitions(tmNR,RatingLabels,"Transition Matrix")
Transition Matrix AAA AA A BBB BB B CCC D ___ ___ ___ ___ ___ ___ ___ ___ AAA 100 0 0 0 0 0 0 0 AA 0 100 0 0 0 0 0 0 A 0 0 100 0 0 0 0 0 BBB 0 0 0 100 0 0 0 0 BB 0 0 0 0 100 0 0 0 B 0 0 0 0 0 100 0 0 CCC 0 0 0 0 0 0 100 0 D 0 0 0 0 0 0 0 100
Display the transition counts and corresponding visualization of the transitions.
hDisplayTransitions(itNR.totalsMat,RatingLabels,strcat("Transition counts, company ID: ",CompanyID_NR))
Transition counts, company ID: DEF AAA AA A BBB BB B CCC D ___ __ _ ___ __ _ ___ _ AAA 0 0 0 0 0 0 0 0 AA 0 0 0 0 0 0 0 0 A 0 0 2 0 0 0 0 0 BBB 0 0 0 2 0 0 0 0 BB 0 0 0 0 0 0 0 0 B 0 0 0 0 0 0 0 0 CCC 0 0 0 0 0 0 0 0 D 0 0 0 0 0 0 0 0
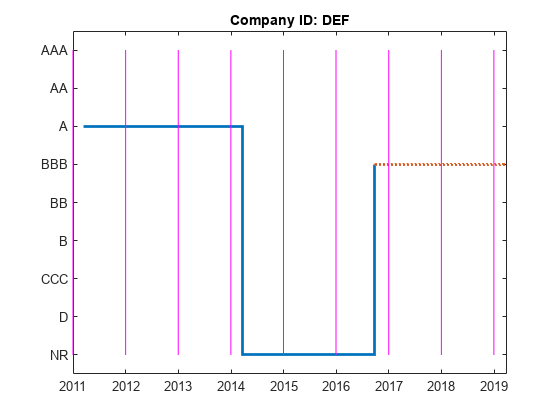
hPlotTransitions(CompanyID_NR,startDateNR,endDateNR,dataNR,RatingLabels)

Consistent with the previous plot, the transition counts still show two transitions from'A'to'A'(from the end of 2012 to the end of 2014), and two transitions from'BBB'to'BBB'(from the end of 2017 to the end of 2019).
However, different from the previous plot, specifying'NR'using the'excludeLabels'name-value input argument oftransprobremoves any transitions into and out of the'NR'rating.
Local Functions
functionhDisplayTransitions(TransitionsData,RatingLabels,Title)% Helper function to format transition information outputsTransitionsAsTable = array2table(TransitionsData,...'VariableNames',RatingLabels,'RowNames',RatingLabels); fprintf('\n%s\n\n',Title) disp(TransitionsAsTable)endfunctionhPlotTransitions(CompanyID,startDate,endDate,data,RatingLabels)% Helper function to visualize transitions between ratingsInd = string(data.ID)==CompanyID; DatesOriginal = datetime(data.Date(Ind),'Locale','en_US'); RatingsOriginal = categorical(data.Rating(Ind),flipud(RatingLabels(:)),flipud(RatingLabels(:))); stairs(DatesOriginal,RatingsOriginal,'LineWidth',2) holdon;% Indicate rating extrapolated into the future (arbitrarily select 91% days after endDate as the last date on the plot)endDateExtrap = endDate+91;ifendDateExtrap>DatesOriginal(end) DatesExtrap = [DatesOriginal(end); endDateExtrap]; RatingsExtrap = [RatingsOriginal(end); RatingsOriginal(end)]; stairs(DatesExtrap,RatingsExtrap,'LineWidth',2,'LineStyle',':')endholdoff;% Add lines to indicate the snapshot dates% transprob uses 1 as the default for 'snapsPerYear', hardcoded here for simplicity% The call to cfdates generates the exact same snapshot dates that transprob usessnapsPerYear = 1; snapDates = cfdates(startDate-1,endDate,snapsPerYear)'; yLimits = ylim;forii=1:length(snapDates) line([snapDates(ii) snapDates(ii)],yLimits,'Color','m')endtitle(strcat("Company ID: ",CompanyID))end
You can also select a web site from the following list:
Americas
- América Latina(Español)
- Canada(English)
- United States(English)
Europe
- Belgium(English)
- Denmark(English)
- Deutschland(Deutsch)
- España(Español)
- Finland(English)
- France(Français)
- Ireland(English)
- Italia(Italiano)
- Luxembourg(English)
- Netherlands(English)
- Norway(English)
- Österreich(Deutsch)
- Portugal(English)
- Sweden(English)
- Switzerland
- United Kingdom(English)