imquantize
Quantize image using specified quantization levels and output values
Syntax
Description
quant_A= imquantize(A,levels)Ausing specified quantization values contained in theNelement vectorlevels. Output imagequant_Ais the same size asAand containsN + 1discrete integer values in the range1toN + 1which are determined by the following criteria:
IfA(k)≤levels(1), thenquant_A(k) =1.
Iflevels(m-1)<A(k)≤levels(m), thenquant_A(k)=m.
IfA(k)>levels(N), thenquant_A(k) =N + 1.
Note thatimquantizeassigns values to the two implicitly defined end intervals:
A(k)≤levels(1)
A(k)>levels(N)
quant_A= imquantize(___,values)N + 1element vectorvalueswhereN=length(levels). Each of theN + 1elements ofvaluesspecify the quantization value for one of theN + 1discrete pixel values inquant_A.
IfA(k)≤levels(1), thenquant_A(k) =values(1).
Iflevels(m-1)<A(k)≤levels(m), thenquant_A(k)=values(m).
IfA(k)>levels(N), thenquant_A(k) =values(N + 1).
Examples
Segment Image into Three Levels Using Two Thresholds
Read image and display it.
I = imread('circlesBrightDark.png'); imshow(I) axisofftitle('Original Image')

Calculate two threshold levels.
thresh = multithresh(I,2);
Segment the image into three levels usingimquantize.
seg_I = imquantize(I,thresh);
Convert segmented image into color image usinglabel2rgband display it.
RGB = label2rgb (seg_I);图;imshow (RGB)轴offtitle('RGB Segmented Image')

Compare Thresholding Entire Image Versus Plane-by-Plane Thresholding
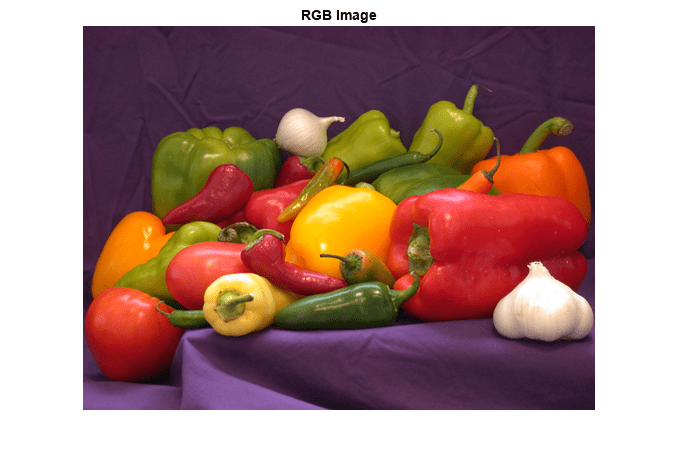
Read truecolor (RGB) image and display it.
I = imread('peppers.png'); imshow(I) axisofftitle('RGB Image');
Generate thresholds for seven levels from the entire RGB image.
threshRGB = multithresh(I,7);
Generate thresholds for each plane of the RGB image.
threshForPlanes = zeros(3,7);fori = 1:3 threshForPlanes(i,:) = multithresh(I(:,:,i),7);end
Process the entire image with the set of threshold values computed from entire image.
value = [0 threshRGB(2:end) 255]; quantRGB = imquantize(I, threshRGB, value);
Process each RGB plane separately using the threshold vector computed from the given plane. Quantize each RGB plane using threshold vector generated for that plane.
quantPlane = zeros( size(I) );for我= 1:3价值=[0刺hForPlanes(i,2:end) 255]; quantPlane(:,:,i) = imquantize(I(:,:,i),threshForPlanes(i,:),value);endquantPlane = uint8(quantPlane);
Display both posterized images and note the visual differences in the two thresholding schemes.
imshowpair(quantRGB,quantPlane,'montage') axisofftitle('Full RGB Image Quantization Plane-by-Plane Quantization')

To compare the results, calculate the number of unique RGB pixel vectors in each output image. Note that the plane-by-plane thresholding scheme yields about 23% more colors than the full RGB image scheme.
dim = size( quantRGB ); quantRGBmx3 = reshape(quantRGB, prod(dim(1:2)), 3); quantPlanemx3 = reshape(quantPlane, prod(dim(1:2)), 3); colorsRGB = unique(quantRGBmx3,'rows'); colorsPlane = unique(quantPlanemx3,'rows'); disp(['Unique colors in RGB image : 'int2str(length(colorsRGB))]);
Unique colors in RGB image : 188
disp(['Unique colors in Plane-by-Plane image : 'int2str(length(colorsPlane))]);
Unique colors in Plane-by-Plane image : 231
Threshold grayscale image from 256 to 8 levels
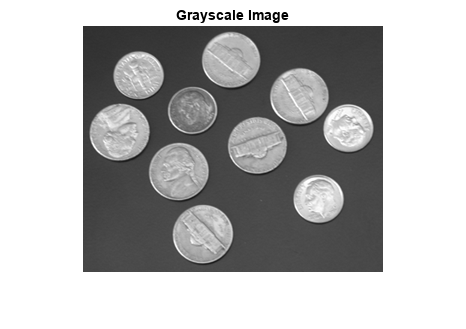
Reduce the number of discrete levels in an image from 256 to 8. This example uses two different methods for assigning values to each of the eight output levels.
Read image and display it.
I = imread('coins.png'); imshow(I) axisofftitle('Grayscale Image')
Split the image into eight levels by obtaining seven thresholds from multithresh.
thresh = multithresh(I,7);
Construct thevaluesMaxvector such that the maximum value in each quantization interval is assigned to the eight levels of the output image.
valuesMax = [thresh max(I(:))]
valuesMax =1x8 uint8 row vector65 88 119 149 169 189 215 255
[quant8_I_max, index] = imquantize(I,thresh,valuesMax);
Similarly, construct thevaluesMinvector such that the minimum value in each quantization interval is assigned to the eight levels of the output image. Instead of callingimquantizeagain with the vectorvaluesMin, use the output argument index to assign those values to the output image.
valuesMin = [min(I(:)) thresh]
valuesMin =1x8 uint8 row vector23 65 88 119 149 169 189 215
quant8_I_min = valuesMin(index);
Display both eight-level output images side by side.
imshowpair(quant8_I_min,quant8_I_max,'montage') title('Minimum Interval Value Maximum Interval Value')

Input Arguments
Output Arguments
Extended Capabilities
See Also
Introduced in R2012b
Select a Web Site
Choose a web site to get translated content where available and see local events and offers. Based on your location, we recommend that you select:.
Selectweb siteYou can also select a web site from the following list:
Americas
- América Latina(Español)
- Canada(English)
- United States(English)
Europe
- Belgium(English)
- Denmark(English)
- Deutschland(Deutsch)
- España(Español)
- Finland(English)
- France(Français)
- Ireland(English)
- Italia(Italiano)
- Luxembourg(English)
- Netherlands(English)
- Norway(English)
- Österreich(Deutsch)
- Portugal(English)
- Sweden(English)
- Switzerland
- United Kingdom(English)