使用激光雷达探测、分类和跟踪车辆
这个例子展示了如何检测、分类和利用激光雷达点云数据的车辆被激光雷达传感器安装在一个自我。在本例中使用的激光雷达数据记录从高速公路的行驶场景。在这个例子中,点云数据分割来决定使用的对象类PointSeg网络。联合概率数据关联(JPDA)追踪与交互式多模型滤波器用于跟踪检测到车辆。
概述
感知模块中扮演一个重要的角色在实现完全自治车辆ADAS系统。激光雷达和摄像头传感器感知工作流至关重要。激光雷达善于提取准确的深度信息的对象,而相机产生丰富和详细的信息环境为对象分类是有用的。
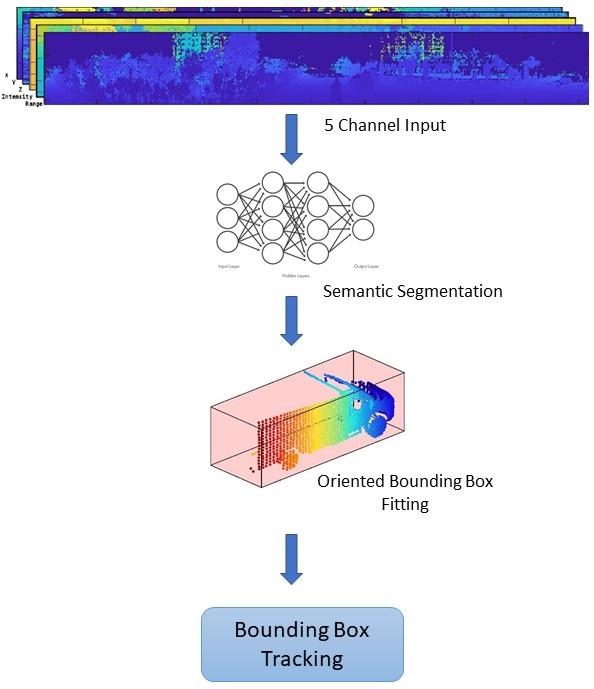
这个例子主要包括这些部分:
地平面分割
语义分割
面向边界框装配
跟踪方向包围盒
整个系统的流程图概述。
加载数据
激光雷达传感器生成的点云数据组织格式或一个无组织的格式。在本例中使用的数据收集使用一个下台OS1激光雷达传感器。这个激光雷达产生一个有组织的与64年水平扫描线点云。点云数据由三个频道,代表x- - - - - -,y- - - - - -,z点的坐标。每个通道的尺寸64 - 1024。使用辅助函数helperDownloadData下载数据并将它们加载到MATLAB®工作区。
注意:这个下载可以花几分钟。
[ptClouds, pretrainedModel] = helperDownloadData;
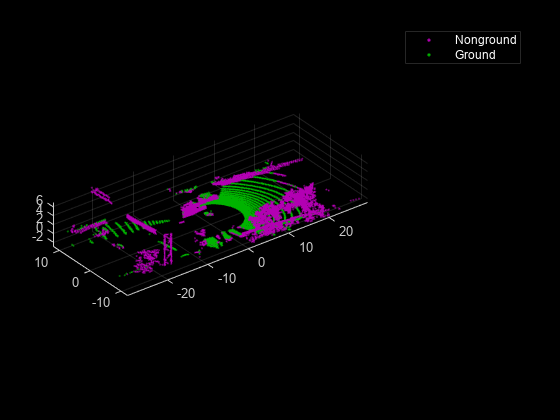
地平面分割
这个示例使用了一个混合方法使用segmentGroundFromLidarData和pcfitplane功能。首先,估计地平面参数使用segmentGroundFromLidarData函数。估计地平面分为带沿的方向车辆为了适应飞机,使用pcfitplane函数在每个地带。这种混合方法强劲的地平面分段的方式和处理点云的变化。
%负载点云ptCloud = ptClouds {1};%定义裁剪点云的ROIxLimit = (-30, 30);yLimit = (-12, 12);zLimit = (3、15);投资回报率= [xLimit、yLimit zLimit];%提取地平面[nonGround、地面]= helperExtractGround (ptCloud roi);图;pcshowpair (nonGround、地面);传奇({{白}Nonground \颜色的,“地面颜色\{白}”},“位置”,“northeastoutside”);
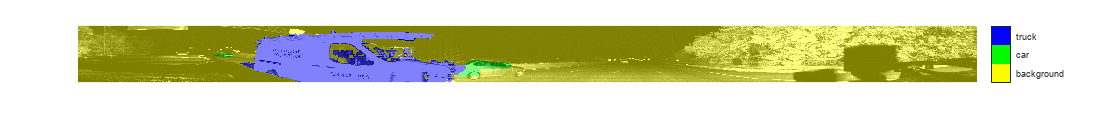
语义分割
这个例子使用一个pretrainedPointSeg网络模型。PointSeg是一个端到端的实时语义分割网络训练对象类,如汽车,卡车,和背景。网络是一个蒙面的输出图像每个像素标记/它的类。这个面具用于点云过滤不同类型的对象。网络的输入是五频图像,x, y, z,强度和范围。为更多的信息在网络上或如何训练网络,参考激光雷达点云的语义分割使用PointSeg深度学习网络的例子。
准备输入数据
的helperPrepareData函数生成五频加载的数据点云数据。
%负载样本帧并将其可视化帧= helperPrepareData (ptCloud);图;次要情节(5、1、1);显示亮度图像(帧(:,:1));标题(“X频道”);次要情节(5、1、2);显示亮度图像(帧(::2));标题(“Y”频道);次要情节(5、1,3);显示亮度图像(帧(:,:,3));标题(“Z频道”);次要情节(5、1、4);显示亮度图像(帧(::4));标题(“强度通道”);次要情节(5、1、5);显示亮度图像(帧(::5));标题(“范围通道”);

从加载运行提出推论一帧pre-trained网络。
如果~ (“净”,“var”)净= pretrainedModel.net;结束%定义类类= [“背景”,“汽车”,“卡车”];%定义彩色地图lidarColorMap = (0.98 0.98 0.00%未知0.01 0.98 0.01%绿色汽车0.01 0.01 0.98%蓝色的摩托车];运行%传球前进pxdsResults = semanticseg(框架、网络);%叠加强度图像分割输出segmentedImage = labeloverlay (uint8(帧(:,:,4)),pxdsResults,“Colormap”lidarColorMap,“透明”,0.5);%显示结果图;imshow (segmentedImage);helperPixelLabelColorbar (lidarColorMap、类);
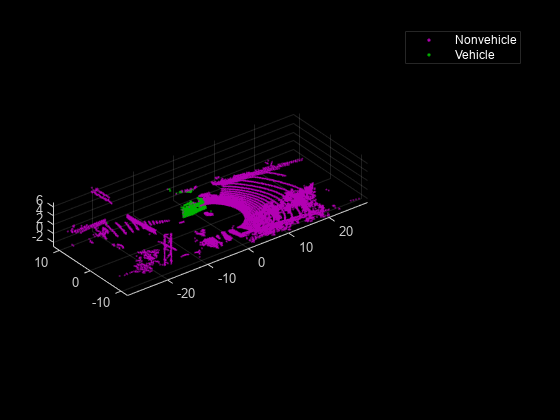
使用生成的语义包含卡车面罩过滤点云。同样,过滤其他类的点云。
truckIndices = pxdsResults = =“卡车”;truckPointCloud =选择(nonGround truckIndices,“OutputSize”,“全部”);%作物点云为更好的显示croppedPtCloud =选择(ptCloud findPointsInROI (ptCloud roi));croppedTruckPtCloud =选择(truckPointCloud findPointsInROI (truckPointCloud roi));%显示地面和nonground点图;pcshowpair (croppedPtCloud croppedTruckPtCloud);传奇({{白}Nonvehicle \颜色的,“{白}\颜色车”},“位置”,“northeastoutside”);
集群和边界框
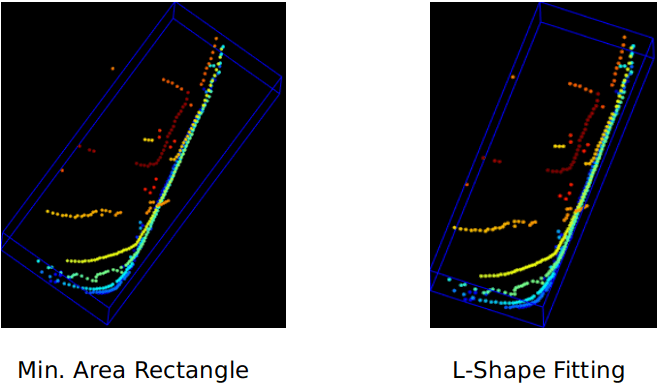
经过提取点云的不同的对象类,对象是通过应用欧几里得集群使用集群pcsegdist函数。组所有的点属于一个集群,集群是获得的点云nonground点作为种子点增长地区。使用findNearestNeighbors函数来遍历所有点区域生长。提取的集群是安装在一个l型的空间边界框使用pcfitcuboid函数。这些集群的车辆像形状的字母L当从一个自上而下的观点。该功能有助于评估车辆的方向。方向包围盒配件有助于评估对象的航向角,这是有用的应用程序,如路径规划和交通机动。
计算集群的长方体的界限也可以通过寻找每个方向的最小和最大空间区段。然而,这种方法失败在评估检测到车辆的方向。这两种方法的区别是图所示。
[标签,numClusters] = pcsegdist (croppedTruckPtCloud, 1);%定义长方体参数params = 0 (0, 9);为clusterIndex = 1: numClusters ptsInCluster = = = clusterIndex标签;电脑=选择(croppedTruckPtCloud ptsInCluster);位置= pc.Location;xl = (max(位置(:1))- min(位置(:1)));yl = (max(位置(:,2))- min(位置(:,2)));zl = (max(位置(:,3))- min(位置(:,3)));%过滤小边框如果大小(位置1)*大小(位置2)> 20任何(任何(pc.Location)) & & & & xl > 1 & & yl > 1指数= 0 (0,1);objectPtCloud = pointCloud(位置);为i = 1:尺寸(位置1)seedPoint =位置(我:);指数(终端+ 1)= findNearestNeighbors (nonGround seedPoint 1);结束%去除重叠指数指数=独特(指标);%的边界框模型= pcfitcuboid(选择(nonGround,指数));参数(+ 1,:)= model.Parameters;结束结束%显示点云,检测到的边界框图;pcshow (croppedPtCloud.Location croppedPtCloud.Location (:, 3));showShape (“长方体”参数,“颜色”,“红色”,“标签”,“卡车”);

可视化设置
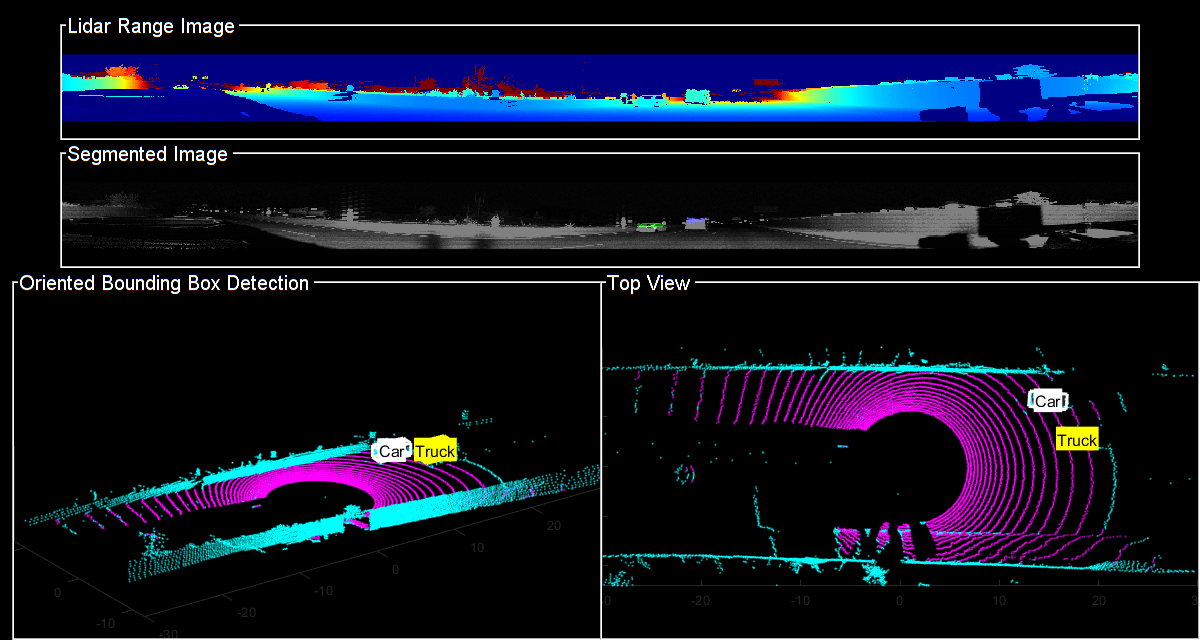
使用helperLidarObjectDetectionDisplay在一个窗口类可视化完整的工作流。可视化窗口的布局分为以下部分:
激光雷达图像范围:点云图像在一系列二维图像
分段形象:检测到标签产生的语义分割网络覆盖强度图像或第四频道的数据
面向方向包围盒检测:三维点云的边界框
顶视图:面向顶视图的点云的边界框
显示= helperLidarObjectDetectionDisplay;
遍历数据
的helperLidarObjectDetection类是一个包装器封装所有的分割、聚类和边界框装配步骤在上面提到的部分。使用findDetections函数来提取检测对象。
%初始化对象激光雷达探测器lidarDetector = helperLidarObjecDetector (“模型”净,“XLimits”xLimit,…“YLimit”yLimit,“ZLimit”,zLimit);% 5 d的激光雷达数据做好准备inputData = helperPrepareData (ptClouds);%设置随机数发生器可重复的结果S = rng (2018);%初始化显示initializeDisplay(显示);numFrames =元素个数(inputData);为数= 1:numFrames%获得当前数据输入= inputData{数};rangeImage =输入(::5);从激光雷达数据%提取物的边界框,边界框((大小)coloredPtCloud pointLabels] = detectBbox (lidarDetector、输入);%更新显示彩色点云updatePointCloud(显示、coloredPtCloud);%更新边界框updateBoundingBox()边界框(显示、大小);%更新分割图像updateSegmentedImage(显示、pointLabels rangeImage);drawnow (“limitrate”);结束
跟踪方向包围盒
在本例中,您使用一个联合概率数据关联(JPDA)追踪。的时间步dt设置为0.1秒,因为数据集捕获10赫兹。用于追踪状态空间模型是基于一个长方体模型参数,
。为更多的细节在激光雷达数据如何追踪边界框,查看使用激光雷达跟踪车辆:从点云来跟踪列表(传感器融合和跟踪工具箱)的例子。在这个例子中,使用提供的类信息ObjectAttributes财产的objectDetection对象。在创建新线路时,过滤器的初始化函数,定义使用helper函数helperMultiClassInitIMMFilter使用检测建立初始的类对象的维度。这有助于调整边界框的跟踪器跟踪的度量模型与相应的维度。
JPDA追踪对象设置这些参数。
assignmentGate = (100);%赋值阈值;confThreshold = 10 [7];%历史罗技确认阈值delThreshold = [2 3];%历史删除阈值逻辑Kc = 1 e-5;每单位体积%虚警率% IMM滤波器的初始化函数filterInitFcn = @helperMultiClassInitIMMFilter;%的联合概率数据关联与IMM滤波器跟踪追踪= trackerJPDA (“FilterInitializationFcn”filterInitFcn,…“TrackLogic”,“历史”,…“AssignmentThreshold”assignmentGate,…“ClutterDensity”Kc,…“ConfirmationThreshold”confThreshold,…“DeletionThreshold”delThreshold,“InitializationThreshold”,0);allTracks =结构([]);时间= 0;dt = 0.1;%定义测量噪声measNoise = blkdiag(0.25 *眼(3),25岁,眼(3));numTracks = 0 (numFrames, 2);
检测对象的单元阵列组装objectDetection(自动驾驶工具箱)对象的使用helperAssembleDetections函数。
显示= helperLidarObjectDetectionDisplay;initializeDisplay(显示);为数= 1:numFrames =时间+ dt;%获得当前数据输入= inputData{数};rangeImage =输入(::5);从激光雷达数据%提取物的边界框,边界框((大小)coloredPtCloud pointLabels] = detectBbox (lidarDetector、输入);%将边界盒组装成objectDetections,边界框(检测= helperAssembleDetections(大小)measNoise、时间);%通过检测跟踪如果~ isempty(检测)%更新追踪[confirmedTracks, tentativeTracks allTracks信息]=追踪(检测、时间);numTracks(计数,1)=元素个数(confirmedTracks);结束%更新显示彩色点云updatePointCloud(显示、coloredPtCloud);%更新分割图像updateSegmentedImage(显示、pointLabels rangeImage);%更新显示是否非空轨道如果~ isempty (confirmedTracks) updateTracks(显示、confirmedTracks);结束drawnow (“limitrate”);结束

总结
这个例子展示了如何检测和分类车辆配备的激光雷达数据的边界框。您还了解了如何使用IMM滤波器跟踪对象具有多个类信息。语义分割结果可以进一步提高通过添加更多的培训数据。
万博1manbetx支持功能
helperPrepareData
函数multiChannelData = helperPrepareData(输入)%创建5-channel数据x, y, z,强度和范围%的大小64 -从pointCloud通过- 1024 - 5。如果isa(输入,“细胞”)numFrames =元素个数(输入);multiChannelData =细胞(1、numFrames);为i = 1: numFrames inputData =输入{我};x = inputData.Location (:,: 1);y = inputData.Location (:: 2);z = inputData.Location (:,:, 3);强度= inputData.Intensity;=√x范围。y ^ 2 +。^ 2 + z。^ 2);multiChannelData{我}=猫(3,x, y, z,强度、范围);结束其他的x = input.Location (:,: 1);y = input.Location (:: 2);z = input.Location (:,:, 3);强度= input.Intensity;=√x范围。y ^ 2 +。^ 2 + z。^ 2);multiChannelData =猫(x, y, z,强度、范围);结束结束
pixelLabelColorbar
函数一会helperPixelLabelColorbar(提出)% colorbar添加到当前轴。colorbar是格式化%显示类名与颜色。甘氨胆酸colormap(提出)% colorbar添加到当前的图。c = colorbar (“对等”甘氨胆酸,);%为刻度线使用类名。c。TickLabels =一会;numClasses =大小(提出,1);%中心标记标签。c。蜱虫= 1 / (numClasses * 2): 1 / numClasses: 1;%去除刻度线。c。TickLength = 0;结束
helperExtractGround
函数[ptCloudNonGround, ptCloudGround] = helperExtractGround (ptCloudIn roi)%作物的点云idx = findPointsInROI (ptCloudIn roi);电脑=选择(ptCloudIn idx,“OutputSize”,“全部”);%的地平面使用分段平面拟合指数[ptCloudGround, idx] = piecewisePlaneFitting (pc, roi);nonGroundIdx = true(大小(pc.Location [1, 2]));nonGroundIdx (idx) = false;nonGroundIdx ptCloudNonGround =选择(个人电脑,“OutputSize”,“全部”);结束函数[groundPlane, idx] = piecewisePlaneFitting (ptCloudIn roi) groundPtsIdx =…segmentGroundFromLidarData (ptCloudIn…“ElevationAngleDelta”5,“InitialElevationAngle”15);groundPC =选择(ptCloudIn groundPtsIdx,“OutputSize”,“全部”);% 3地区分轴roi segmentLength = (roi (2) - (1)) / 3;x1 = [roi (1), roi (1) + segmentLength];x2 = [x1 x1 (2), (2) + segmentLength];x3 = (x2 (2) x2 (2) + segmentLength];roi1 = (x1, roi(3:结束));roi2 = (x2, roi(3:结束));roi3 = [x3, roi(3:结束)];idxBack = findPointsInROI (groundPC roi1);idxCenter = findPointsInROI (groundPC roi2);idxForward = findPointsInROI (groundPC roi3);%打破前后的点云ptBack =选择(groundPC idxBack,“OutputSize”,“全部”);ptForward =选择(groundPC idxForward,“OutputSize”,“全部”);[~,inliersForward] = planeFit (ptForward);[~,inliersBack] = planeFit (ptBack);idx = [inliersForward;idxCenter;inliersBack];groundPlane =选择(ptCloudIn idx,“OutputSize”,“全部”);结束函数(飞机,inlinersIdx) = planeFit (ptCloudIn) [inlinersIdx, ~ ~] = pcfitplane (ptCloudIn 1 [0, 0, 1]);飞机=选择(ptCloudIn inlinersIdx,“OutputSize”,“全部”);结束
helperAssembleDetections
函数mydetections = helperAssembleDetections (bboxes measNoise,时间戳)%组装边框objectDetection单元阵列mydetections =细胞(大小(bboxes, 1), 1);为i = 1:尺寸(bboxes 1) classid = bboxes(我,结束);lidarModel = [bboxes (1:3), bboxes(我end-1) bboxes(我4:6)];%,以避免直接追踪确认,ClassID传递% ObjectAttributes。mydetections{我}= objectDetection(时间戳,…lidarModel’,“MeasurementNoise”,…measNoise,“ObjectAttributes”结构(“ClassID”classid));结束结束
helperDownloadData
函数[lidarData, pretrainedModel] = helperDownloadData outputFolder = fullfile (tempdir,批发价格指数的);url =“https://ssd.mathworks.com/万博1manbetxsupportfiles/lidar/data/lidarSegmentationAndTrackingData.tar.gz”;lidarDataTarFile = fullfile (outputFolder,“lidarSegmentationAndTrackingData.tar.gz”);如果~存在(lidarDataTarFile“文件”mkdir (outputFolder);websave (lidarDataTarFile、url);解压(lidarDataTarFile outputFolder);结束%检查焦油。gz文件下载,但不是未压缩的如果~ (fullfile (outputFolder,存在“WPI_LidarData.mat”),“文件”)解压(lidarDataTarFile outputFolder);结束%载激光雷达数据data =加载(fullfile (outputFolder“highwayData.mat”));lidarData = data.ptCloudData;%下载pretrained模型url =“https://ssd.mathworks.com/万博1manbetxsupportfiles/lidar/data/pretrainedPointSegModel.mat”;modelFile = fullfile (outputFolder,“pretrainedPointSegModel.mat”);如果~存在(modelFile“文件”)websave (modelFile url);结束pretrainedModel =负载(fullfile (outputFolder“pretrainedPointSegModel.mat”));结束
引用
[1]小张,天涯问答,Chiyu盾和约翰·m·多兰“高效笔适合车辆检测使用激光扫描仪”,IEEE智能车辆研讨会,2017年6月
[2]y . Wang t·施p . Yun l . Tai和m .刘”Pointseg:实时语义分割基于3 d激光雷达点云,“arXiv预印本arXiv: 1807.06288, 2018。