Root Locus Design
Root locus design is a common control system design technique in which you edit the compensator gain, poles, and zeros in the root locus diagram.
As the open-loop gain,k, of a control system varies over a continuous range of values, the root locus diagram shows the trajectories of the closed-loop poles of the feedback system. For example, in the following tracking system:
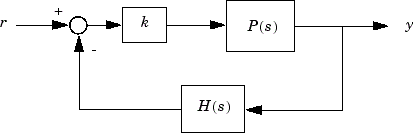
P(s) is the plant,H(s) is the sensor dynamics, andkis an adjustable scalar gain The closed-loop poles are the roots of
The root locus technique consists of plotting the closed-loop pole trajectories in the complex plane askvaries. You can use this plot to identify the gain value associated with a desired set of closed-loop poles.
Tune Electrohydraulic Servomechanism Using Root Locus Graphical Tuning
This example shows how to design a compensator for an electrohydraulic servomechanism using root locus graphical tuning techniques.
Plant Model
A simple version of an electrohydraulic servomechanism model consists of
A push-pull amplifier (a pair of electromagnets)
A sliding spool in a vessel of high-pressure hydraulic fluid
Valve openings in the vessel to allow for fluid to flow
A central chamber with a piston-driven ram to deliver force to a load
A symmetrical fluid return vessel
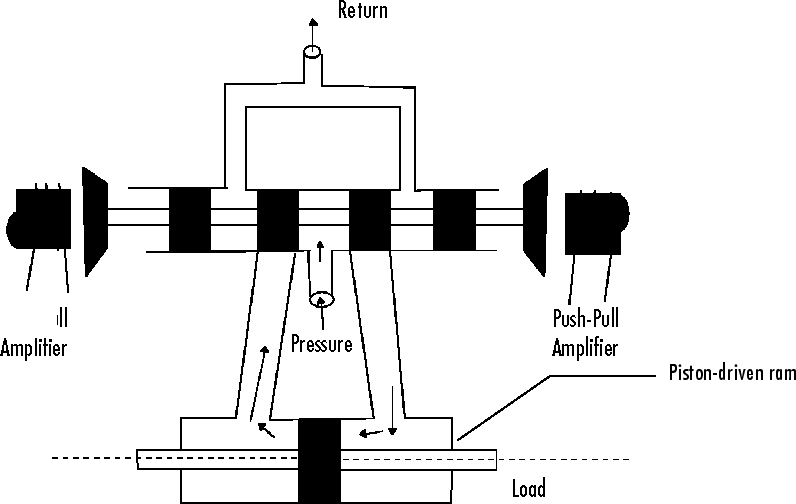
The force on the spool is proportional to the current in the electromagnet coil. As the spool moves, the valve opens, allowing the high-pressure hydraulic fluid to flow through the chamber. The moving fluid forces the piston to move in the opposite direction of the spool. For more information on this model, including the derivation of a linearized model, see[1].
You can use the input voltage to the electromagnet to control the ram position. When measurements of the ram position are available, you can use feedback for the ram position control, as shown in the following, whereGservorepresents the servomechanism:

Design Requirements
For this example, tune the compensator,C(s) to meet the following closed-loop step response requirements:
The 2% settling time is less than 0.05 seconds.
The maximum overshoot is less than 5%.
Open Control System Designer
At the MATLAB®command line, load a linearized model of the servomechanism, and openControl System Designerin the root locus editor configuration.
loadltiexamplesGservocontrolSystemDesigner('rlocus',Gservo);
The app opens and importsGservoas the plant model for the default control architecture,Configuration 1.
InControl System Designer, aRoot Locus Editorplot and input-outputStep Responseopen.
To view the open-loop frequency response and closed-loop step response simultaneously, click and drag the plots to the desired location.
The app displaysBode EditorandStep Responseplots side-by-side.

In the closed-loop step response plot, the rise time is around two seconds, which does not satisfy the design requirements.
To make the root locus diagram easier to read, zoom in. In theRoot Locus Editor, right-click the plot area and selectProperties.
In the Property Editor dialog box, on theLimitstab, specifyReal AxisandImaginary Axislimits from-500to500.

Click克罗se.
Increase Compensator Gain
To create a faster response, increase the compensator gain. In theRoot Locus Editor, right-click the plot area and selectEdit Compensator.
In the Compensator Editor dialog box, specify a gain of20.

In theRoot Locus Editorplot, the closed-loop pole locations move to reflect the new gain value. Also, theStep Responseplot updates.

The closed-loop response does not satisfy the settling time requirement and exhibits unwanted ringing.
Increasing the gain makes the system underdamped and further increases lead to instability. Therefore, to meet the design requirements, you must specify additional compensator dynamics. For more information on adding and editing compensator dynamics, seeEdit Compensator Dynamics.
Add Poles to Compensator
To add a complex pole pair to the compensator, in theRoot Locus Editor, right-click the plot area and selectAdd Pole/Zero>Complex Pole. Click the plot area where you want to add one of the complex poles.

The app adds the complex pole pair to the root locus plot as redX’s, and updates the step response plot.
In theRoot Locus Editor, drag the new poles to locations near–140 ± 260i. As you drag one pole, the other pole updates automatically.

Tip
As you drag a pole or zero, the app displays the new value in the status bar, on the right side.

Add Zeros to Compensator
To add a complex zero pair to your compensator, in the Compensator Editor dialog box, right-click theDynamicstable, and selectAdd Pole/Zero>Complex Zero

The app adds a pair of complex zeros at–1 ±ito your compensator
In theDynamicstable, click theComplex Zero行。然后在Edit Selected Dynamicssection, specify a实部of-170and anImaginary Partof430.

The compensator and response plots automatically update to reflect the new zero locations.

In theStep Responseplot, the settling time is around 0.1 seconds, which does not satisfy the design requirements.
调整杆和泽ro Locations
The compensator design process can involve some trial and error. Adjust the compensator gain, pole locations, and zero locations until you meet the design criteria.
One possible compensator design that satisfies the design requirements is:
Compensator gain of
10Complex poles at–110 ± 140i
Complex zeros at–70 ± 270i
In the Compensator Editor dialog box, configure your compensator using these values. In theStep Responseplot, the settling time is around 0.05 seconds.

To verify the exact settling time, right-click theStep Responseplot area and selectCharacteristics>Settling Time. A settling time indicator appears on the response plot.
To view the settling time, move the cursor over the settling time indicator.

The settling time is about 0.043 seconds, which satisfies the design requirements.
References
[1] Clark, R. N.Control System Dynamics, Cambridge University Press, 1996.
See Also
Control System Designer|rlocusplot
Related Topics
You can also select a web site from the following list:
Americas
- América Latina(Español)
- Canada(English)
- United States(English)
Europe
- Belgium(English)
- Denmark(English)
- Deutschland(Deutsch)
- España(Español)
- Finland(English)
- France(Français)
- Ireland(English)
- Italia(Italiano)
- Luxembourg(English)
- Netherlands(English)
- Norway(English)
- Österreich(Deutsch)
- Portugal(English)
- Sweden(English)
- Switzerland
- United Kingdom(English)