In this blog, we are applying a Deep Learning (DL) based technique for detecting COVID-19 on Chest Radiographs using MATLAB.
Background
Coronavirus disease(COVID-19) is a new strain of disease in humans discovered in 2019 that has never been identified in the past. Coronavirus is a large family of viruses that causes illness in patients ranging from common cold to advanced respiratory syndromes such as Middle East Respiratory Syndrome (MERS-COV) and Severe Acute Respiratory Syndrome (SARS-COV). Many people are currently affected and are being treated across the world causing a global pandemic. In the United States alone, 160 million to 214 million people could be infected over the course of the COVID-19 epidemic (
https://www.nytimes.com/2020/03/13/us/coronavirus-deaths-estimate.html). Several countries have declared a national emergency and have quarantined millions of people. Here is a detailed article on how coronavirus affects people:
https://www.nytimes.com/article/coronavirus-body-symptoms.html
Detection and diagnosis toolsoffer a valuable second opinion to the doctors and assist them in the screening process. This type of mechanism would also assist in providing results to the doctors quickly. In this blog, we are applying a Deep Learning (DL) based technique for detecting COVID-19 on Chest Radiographs using MATLAB.
The
COVID-19 datasetutilized in this blog was curated by
Dr. Joseph Cohen, a postdoctoral fellow at the University of Montreal. Thanks to the
articleby
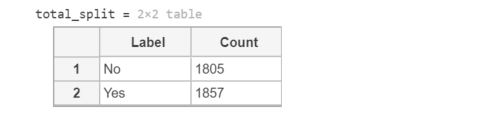
Dr. Adrian Rosebrockfor making this chest radiograph dataset reachable to researchers across the globe and for presenting the initial work using DL. Note that we solely utilize the x-ray images. You should be able to download the images from the article directly. After downloading the ZIP files from the website and extracting them to a folder called "Covid 19", we have one sub-folder per class in "dataset". Label "Covid" indicates the presence of COVID-19 in the patient and "normal" otherwise. Since, we have equal distribution (25 images) of both classes, there is no class imbalance issue here.
Load the Dataset
Let's begin by loading the database using
imageDatastore. It is a computationally efficient function to load the images along with its labels for analysis.
clear; close all; clc;datapath='dataset';imds=imageDatastore(datapath, ... 'IncludeSubfolders',true, ... 'LabelSource','foldernames');total_split=countEachLabel(imds)

Visualize the Images
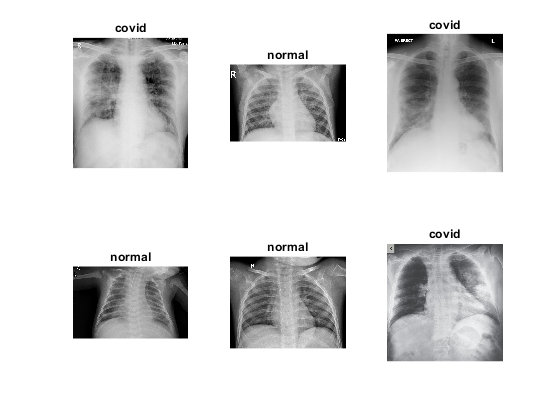
Let's visualize the images and see how images differ for each class. It would also help us determine the type of classification technique that could be applied for distinguishing the two classes. Based on the images, we could identify preprocessing techniques that would assist our classification process. We could also determine the type of CNN architecture that could be utilized for the study based on the similarities within the class and differences across classes.
num_images=length(imds.Labels);perm=randperm(num_images,6); figure; for idx=1:length(perm) subplot(2,3,idx); imshow(imread(imds.Files{perm(idx)})); title(sprintf('%s',imds.Labels(perm(idx)))) end
In order to ease the classification process for our DL architecture, we apply simple preprocessing techniques and the function is enclosed at the end of this article.
K-fold Validation
As you already know that there is a limited set of images available in this dataset, we split the dataset into 10-folds for analysis i.e. 10 different algorithms would be trained using different set of images from the dataset. This type of validation study would provide us a better estimate of our performance in comparison to typical hold-out validation method.
We adopt ResNet-50 architecture in this blog as it has proven to be highly effective for various medical imaging applications [1,2].
num_folds=10;for fold_idx=1:num_folds fprintf('Processing %d among %d folds \n',fold_idx,num_folds);test_idx=fold_idx:num_folds:num_images;imdsTest = subset(imds,test_idx);train_idx=setdiff(1:length(imds.Files),test_idx);imdsTrain = subset(imds,train_idx);net=resnet50; lgraph = layerGraph(net); clear net;numClasses = numel(categories(imdsTrain.Labels));newLearnableLayer = fullyConnectedLayer(numClasses, ... 'Name','new_fc', ... 'WeightLearnRateFactor',10, ... 'BiasLearnRateFactor',10);lgraph = replaceLayer(lgraph,'fc1000',newLearnableLayer); newsoftmaxLayer = softmaxLayer('Name','new_softmax'); lgraph = replaceLayer(lgraph,'fc1000_softmax',newsoftmaxLayer); newClassLayer = classificationLayer('Name','new_classoutput'); lgraph = replaceLayer(lgraph,'ClassificationLayer_fc1000',newClassLayer);imdsTrain.ReadFcn = @(filename)preprocess_Xray(filename); imdsTest.ReadFcn = @(filename)preprocess_Xray(filename);options = trainingOptions('adam',... 'MaxEpochs',30,'MiniBatchSize',8,... 'Shuffle','every-epoch', ... 'InitialLearnRate',1e-4, ... 'Verbose',false, ... 'Plots','training-progress');增量= imageDataAugmenter(…“RandRotation”,[-5 5],'RandXReflection',1,... 'RandYReflection',1,'RandXShear',[-0.05 0.05],'RandYShear',[-0.05 0.05]);auimds = augmentedImageDatastore([224 224],imdsTrain,'DataAugmentation',augmenter);netTransfer = trainNetwork(auimds,lgraph,options);augtestimds = augmentedImageDatastore([224 224],imdsTest);[predicted_labels(test_idx),posterior(test_idx,:)] = classify(netTransfer,augtestimds);save(sprintf('ResNet50_%d_among_%d_folds',fold_idx,num_folds),'netTransfer','test_idx','train_idx');clearvars -except fold_idx num_folds num_images predicted_labels posterior imds netTransfer; end
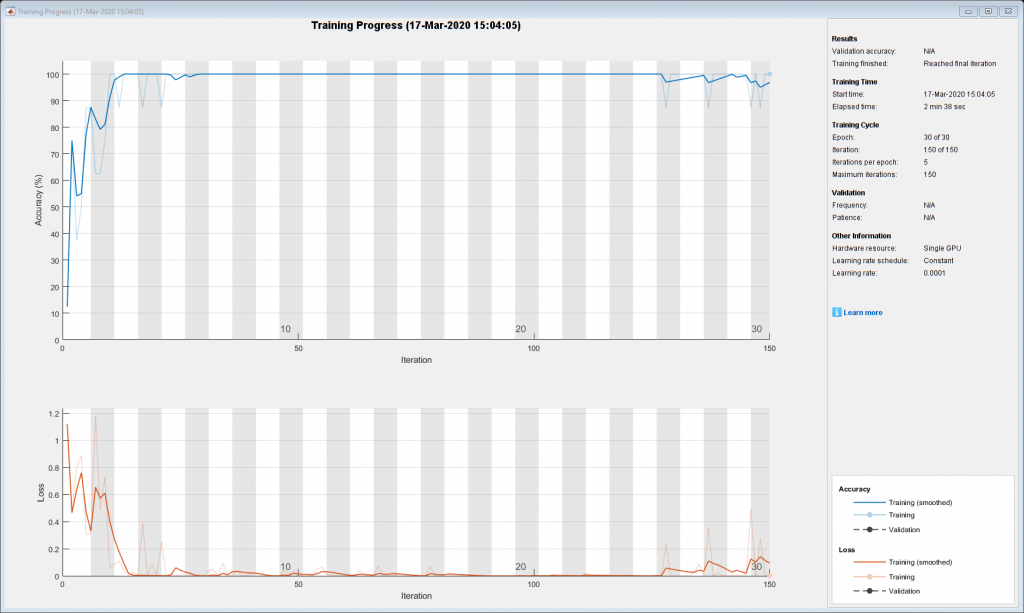
Each fold will display a training plot while training, for brevity this is only showing the final training plot, fold 10 of 10.
Performance Study
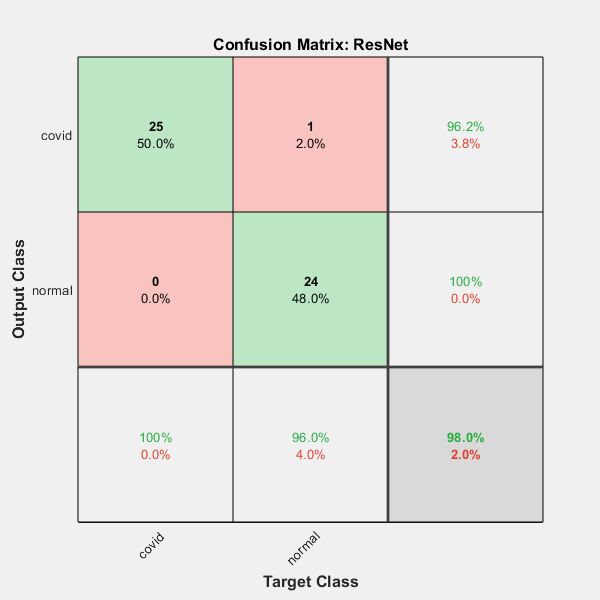
Let's measure the performance of our algorithm in terms of confusion matrix - This metric also gives a good idea of the performance in terms of precision and recall. We believe overall accuracy is a good indicator as the testing dataset utilized in this study is uniformly distributed (in terms of images belonging to each category).
Confusion Matrix
actual_labels=imds.Labels;figure; plotconfusion(actual_labels,predicted_labels') title('Confusion Matrix: ResNet');
 ROC Curve
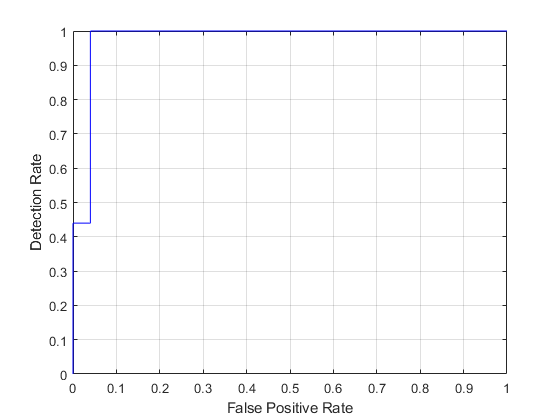
ROC would assist the doctors in choosing their operating point in terms of false positive and detection rate.
test_labels=double(nominal(imds.Labels));[fp_rate,tp_rate,T,AUC]=perfcurve(test_labels,posterior(:,1),1); figure; plot(fp_rate,tp_rate,'b-'); grid on; xlabel('False Positive Rate'); ylabel('Detection Rate');
AUC

Class Activation Mapping
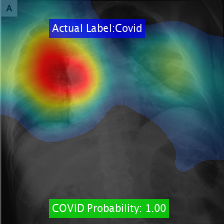
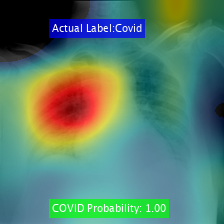
We visualize the Class Activation Mapping (CAM) results for these networks for different COVID-19 cases using the code:
//www.tianjin-qmedu.com/help/deeplearning/examples/investigate-network-predictions-using-class-activation-mapping.html. This would help in providing insights behind the algorithm's decision to the doctors.
Here are the results obtained for various cases:
Test on other publicly available datasets
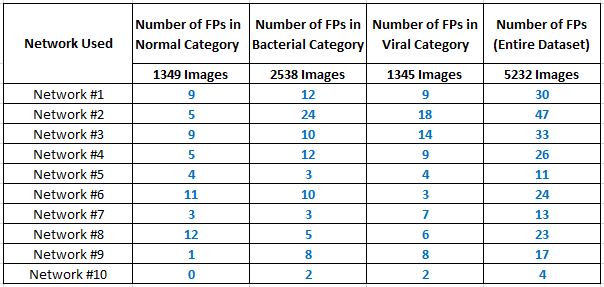
To study and analyze the performance of the algorithm futher, we determine the probability of COVID-19 for other publicly available datasets without any COVID-19 labels. We utilize the cases marked as either Normal, Bacterial Pneumonia or Viral Pneumonia by radiologists presented in [2]. Aforementioned, each network was trained on a different set of images from COVID-19 dataset. Any image with a covid posterior value greater than 0.5 is considered to be a False Positive (FP). Results clearly indicate that our algorithm's specificity and sensitivity is high. Time taken per test case is nearly 13 milliseconds on a single-core GPU.
Conclusions
In this blog, we have presented a simple deep learning-based classification approach for CAD of COVID-19. Classification algorithm using ResNet performed relatively well with a high overall accuracy and AUC. Performance of transfer learning approaches clearly reiterates that CNN based classification models are good in extracting features. Algorithm can be easily re-trained with new sets of labeled images to enhance the performance further. Combining these results with other exisiting architectures would provide a boost in performance both in terms of AUC and overall accuracy. A comprehensive study of these algorithms both in terms of computation (memory and time) and performance provides the subject matter experts to choose algorithms based on their choice. CAD would be of great help for the doctors for COVID-19 screening and would help in providing a valuable second opinion.
References
[1] Narayanan, B. N., De Silva, M. S., Hardie, R. C., Kueterman, N. K., & Ali, R. (2019). "Understanding Deep Neural Network Predictions for Medical Imaging Applications". arXiv preprint arXiv:1912.09621.
[2] Narayanan, B. N., Davuluru, V. S. P., & Hardie, R. C. (2020, March). "Two-stage deep learning architecture for pneumonia detection and its diagnosis in chest radiographs". In Medical Imaging 2020: Imaging Informatics for Healthcare, Research, and Applications (Vol. 11318, p. 113180G). International Society for Optics and Photonics.
Preprocessing Function
function Iout = preprocess_Xray(filename)I = imread(filename);if ~ismatrix(I) I=rgb2gray(I); endIout = cat(3,I,I,I); end
Do you have any questions for Barath on this post? Leave a comment below
 Cleve’s Corner: Cleve Moler on Mathematics and Computing
 The MATLAB Blog
 Steve on Image Processing with MATLAB
 Guy on Simulink
 Deep Learning
 Developer Zone
 Stuart’s MATLAB Videos
 Behind the Headlines
 File Exchange Pick of the Week
 Hans on IoT
 Student Lounge
 MATLAB Community
 MATLAB ユーザーコミュニティー
 Startups, Accelerators, & Entrepreneurs
 Autonomous Systems

 In order to ease the classification process for our DL architecture, we apply simple preprocessing techniques and the function is enclosed at the end of this article.

 ROC Curve
ROC would assist the doctors in choosing their operating point in terms of false positive and detection rate.
ROC Curve
ROC would assist the doctors in choosing their operating point in terms of false positive and detection rate.


Comments
To leave a comment, please clickhereto sign in to your MathWorks Account or create a new one.