 Cleve’s Corner: Cleve Moler on Mathematics and Computing
 The MATLAB Blog
 Steve on Image Processing with MATLAB
 Guy on Simulink
 Deep Learning
 Developer Zone
 Stuart’s MATLAB Videos
 Behind the Headlines
 File Exchange Pick of the Week
 Hans on IoT
 Student Lounge
 MATLAB Community
 MATLAB ユーザーコミュニティー
 Startups, Accelerators, & Entrepreneurs
Don’t Photoshop it…MATLAB it! Image Effects with MATLAB (Part 4)
I'd like to welcome back guest bloggerBrett Shoelsonfor the continuation of his series of posts on implementing image special effects in MATLAB. Brett, a contributor for theFile Exchange Pick of the Week blog, has been doing image processing with MATLAB for almost 20 years now.
[Part 1][Part 2][Part 3][Part 4]
Contents

Out Standing in the Field
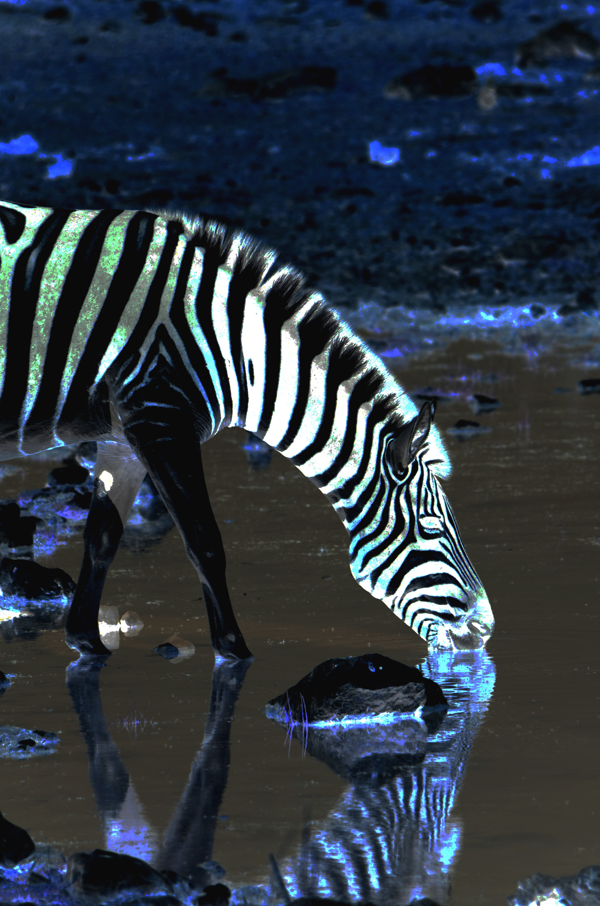
In the three previous entries in this guest series (part 1,part 2,part 3) I've worked my way through some approaches to creating special image effects with MATLAB. I started easy, and increased the difficulty level as I progressed. In this fourth post, I'm going to create the zebra image above. You might guess that doing so will entail segmenting the zebra--certainly the most difficult part of this problem.
I previously wrote that I canusuallyget a good segmentation mask working in on or more grayscale representations of a color image. While I stand by that statement, I will also say that sometimes colordoesprovide good information with which to create a segmentation mask. In fact, I'm going to use color to segment the zebra in this image, and then use the manual masking approach (using theimfreehand- mediated approach I used in the previous post) to fine-tune the mask.
Segmenting by Color
There are several approaches to segmenting using color information. If I wanted to create a mask of a single user-selected color, for instance, I could useimpixelregionto explore colors in a region, or I could invokeimpixelto click-select color samples.
%Note that the |im2double| conversion conveniently scales the intensities to [0,1]URL ='https://blogs.mathworks.com/pick/files/ZebraInField.jpg'; img = im2double(imread(URL)); figure, imshow(img); impixelregion
![]()
impixelregionprovides a convenient tool for exploring the RGB (or grayscale) values underneath a small rectangle; as you drag that rectangle over your image, the intensity values are updated and displayed in a separate figure. In this image, for instance, we might recognize that the grass has an RGB intensity of roughly [0.75 0.65 0.5]. By specifying a "tolerance" of 0.05 (i.e., 5 percent of the color range) we can readily create a mask of "not-zebra" by selecting all pixels that have those approximate red, green, and blue values:
targetColor = [0.75 0.65 0.5]; tolerance = 0.05; mask =...img(:,:,1) >= targetColor(1) - tolerance &...img(:,:,1) <= targetColor(1) + tolerance &...img(:,:,2) >= targetColor(2) - tolerance &...img(:,:,2) <= targetColor(2) + tolerance &...img(:,:,3) >= targetColor(3) - tolerance &...img(:,:,3) <= targetColor(3) + tolerance; figure,imshow(mask);title('Not Zebra?')

Recognize here that each of those constraints on the binary variable "mask" is simply an additional logical AND that I'm applying. I could easily provide different tolerances for ranges above and below each of R, G, and B. (A GUIwith sliders might facilitate that interaction!) I could also create additional masks in a similar manner and combine them, using the logical OR operation, until I achieved the desired segmentation.
Instead of going down that path, though, I'd like to demonstrate another useful approach to color segmentation. In this approach, rather than manually selecting colors on which to base the segmentation mask, I'm going to let MATLAB do the work. The functionrgb2indquantizes an image into a user-specified number of colors. Each of those "quantum levels" can be used to create a unique mask of the image. For instance, here I quantize the zebra into 16 colors and display the binary mask that each index represents:
nColors = 16; X = rgb2ind(img,16);% (X ranges from 0 to nColors-1)forii = 0:nColors-1 subplot(4,4,ii+1) imshow(ismember(X,ii)); title(sprintf('X = %d',ii));end

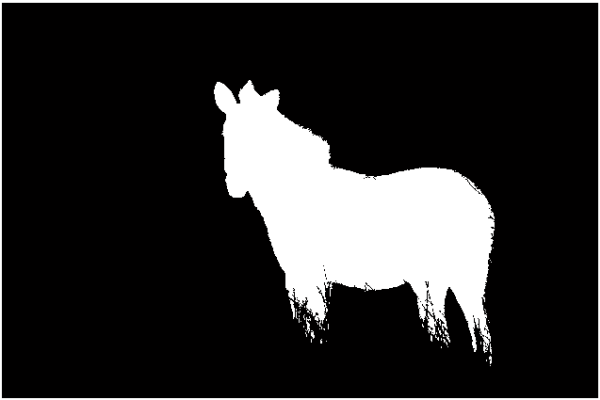
Now at a glance I can construct a segmentation mask of the zebra, selecting only the indices that have a significant component within the area of interest:
mask = ismember(X,[0,2,4,5,7,10:12,14,15]); figure,imshow(mask)

Clearly, there's a tradeoff between including more indices to "solidify" the zebra mask, and increasing the amount of background "noise" included in the segmentation. I like this as a starting point, so I'm going to use this and start refining:
mask = bwareaopen(mask,100);%Remove small blobsmask = imfill(mask,'holes');%Morphologically fill holesfigure,imshow(mask)

Normally, I would useimclearborder删除一个巨大的白色区域的顶部image, and then, usingregionprops, determine the areas of each connected blob. The documentation forregionpropsshows how one could easily use that information to eliminate all but the largest object in the resulting image. (That would presumably leave only the zebra.) But in this case, that would also eliminate all the small isolated regions around the zebra's legs, and I would like to keep those. So instead, I'm going to quickly encircle the zebra usingimfreehand, and use the resulting mask to eliminate all peripheral blobs.
manualMask = imfreehand;

posns = getPosition(manualMask); [m,n,~] = size(mask); includeMask = poly2mask(posns(:,1),posns(:,2),m,n); mask = mask & includeMask; mask = imdilate(mask,strel('disk',2));%Slight tweak hereimshow(mask);
Now to Use the Segmented Zebra
Yes! I like that mask, and can do a lot with it. Conveniently, the functionroifilt2allows me to operate on only a masked portion of an image. That function, though, only works on 2-D images--not on RGB images. However, when it makes sense to do so, I can modify the red, green, and blue planes indendently, and reconstruct the RGB image usingcat. For instance:
processImage{1} = @(x) imadjust(x,[0.05; 0.16],[1.00; 0.11], 1.20);%Red planeprocessImage{2} = @(x) imadjust(x,[0.10; 0.83],[0.00; 1.00], 1.00);%Green planeprocessImage{3} = @(x) imadjust(x,[0.00; 0.22],[1.00; 0.00], 1.10);%Blue planer = roifilt2(img(:,:,1),mask,processImage{1}); g = roifilt2(img(:,:,2),mask,processImage{2}); b = roifilt2(img(:,:,3),mask,processImage{3}); enhancedImg = cat(3,r,g,b); figure,imshow(enhancedImg)

Creating the "normal" zebra in the pastel field is abittrickier, since I can't do a decorrelation stretch plane-by-plane. So instead, I'm going to create the "pastel effect" usingdecorrstretch, and then reset the valuesunderneath the masked zebraback to their original values.
imgEnhanced = decorrstretch(img);%Operating on the original image% Now reset the red plane to the masked value of the original imager = imgEnhanced(:,:,1);% Get the enhanced red planetmp = img(:,:,1);% Get the original red plane%Replace the enhanced red under the mask with the original red:r(mask) = tmp(mask);% Same for greeng = imgEnhanced(:,:,2); tmp = img(:,:,2); g(mask) = tmp(mask);% And blueb = imgEnhanced(:,:,3); tmp = img(:,:,3); b(mask) = tmp(mask);% Now reconstruct the enhanced imageimgEnhanced = cat(3,r,g,b);% And tweak it with imadjust to intensify colorsimgEnhanced = imadjust(imgEnhanced,[0.1; 0.8],[0.00; 1.00], 1.00);%figure, imshow(imgEnhanced); title('Voila!')%(This reproduces the zebra at the top of this post!)
Thanks, a Note on Image Segmentation, and a Challenge
If you are a regular reader of "Steve on Image Processing," then you'll know that I've commandeered Steve's blog for the past several weeks to present my vision of using MATLAB to create special image effects. I'd like to thank Steve for hosting this guest series; I always enjoy reading Steve's blog, and I'm very pleased to contribute to it.
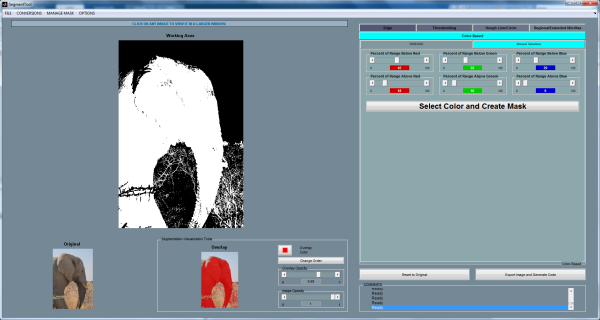
In the course of this guest series, I sharedmy GUIs调整图像强度和尝试different morphological operations and structuring elements. I previously mentioned that segmentation is often the most difficult part of an image processing problem. So, in the spirit of the coming holidays, here's one more GUI that I'd like to share with you:SegmentToolprovides an interactive environment for segmenting images. It currently includes tabs for edge detection, thresholding, Hough transforms, using regional and extended minima and maxima, and color-based segmentation. Take it for a test drive and let me know what you think, or what else you'd like to see incorporated.
This post concludes this guest series, but doesn't nearly exhaust the creative ways in which one can manipulate images using MATLAB and the Image Processing Toolbox. So I'd like to close with a challenge:
- What Effects CanYouCreate with MATLAB? * Share your own cool image effects with us! Show us how, using only MATLAB (and MathWorks Toolboxes, of course) you can create cool image effects. I will catalog, and share on the MATLAB Central File Exchange, useful or fun approaches to creating special effects with images.
注意,这不仅仅是我的改变图像want; please include the code (or at least, pseudo-code, with detail sufficient to allow other users to reproduce the effect). I'll gladly send some swag to anyone who shares an effect that gets included in the special effects gallery. Send your code to me atbrett.shoelson@mathworks.com.
Happy MATLABbing!
All images copyright Brett Shoelson; used with permission.
- Category:
- Special effects


Comments
To leave a comment, please clickhereto sign in to your MathWorks Account or create a new one.