wt
Continuous wavelet transform with filter bank
Syntax
Description
cfs= wt(fb,x)x, usingfb, a CWT filter bank.xis a real- or complex-valued vector.xmust have at least 4 samples. Ifxis real-valued,cfsis a 2-D matrix, where each row corresponds to one scale. The column size ofcfsis equal to the length ofx. Ifxis complex-valued,cfsis a 3-D array, where the first page is the CWT for the positive scales (analytic part or counterclockwise component), and the second page is the cwt for the negative scales (anti-analytic part or clockwise component).
Examples
Continuous Wavelet Transform Using Filter Bank
Load the noisy Doppler signal. Create a CWT filter bank that can be applied to the signal.
loadnoisdoppfb = cwtfilterbank('SignalLength'元素个数(noisdopp));
Use the filter bank to obtain the continuous wavelet transform of the signal.
[cfs,f,coi] = wt(fb,noisdopp);
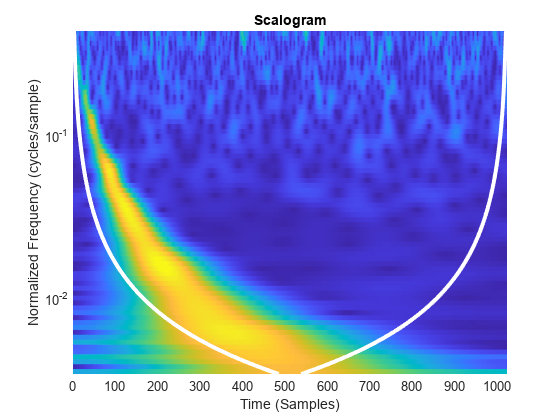
Plot the CWT scalogram, including the cone of influence.
t = 0:numel(noisdopp)-1; pcolor(t,f,abs(cfs)) shadingflatset(gca,'YScale','log') holdonplot(t,coi,'w-','LineWidth',3) xlabel('Time (Samples)') ylabel('Normalized Frequency (cycles/sample)') title('Scalogram')
Inverse Continuous Wavelet Transform Using Scaling Coefficients
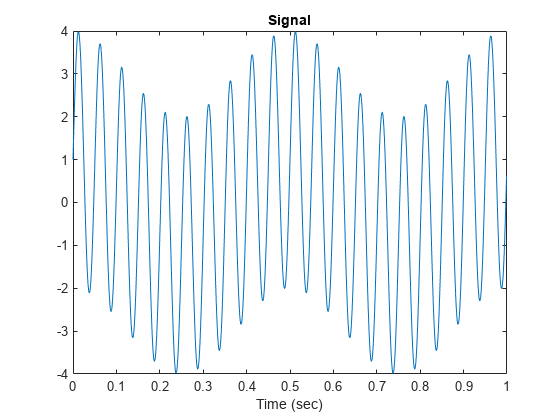
Create and plot a signal sampled at 1000 Hz. Create a CWT filter bank that can be used on the signal. Since the signal is periodic, set the boundary extension property of the filter bank to'periodic'.
Fs = 1000; t = 0:1/Fs:1-1/Fs; sig = 3*sin(2*pi*20*t) + cos(2*pi*2*t); fb = cwtfilterbank('SignalLength',length(sig),'SamplingFrequency',Fs,'Boundary','periodic'); plot(t,sig) xlabel('Time (sec)') title('Signal')
Take the CWT of the signal. Return the wavelet and scaling coefficients.
[cfs,~,~,scalcfs] = wt(fb,sig);
Reconstruct the signal two ways. First use the mean of the signal, then use the scaling coefficients. Plot the difference between the original signal and both reconstructions.
xrec0 = icwt(cfs,“SignalMean”,mean(sig)); xrec1 = icwt(cfs,'ScalingCoefficients',scalcfs); plot(t,sig-xrec0) holdon情节(t, sig-xrec1)网格onlegend('Using mean(sig)','Using scalcfs') title('Difference Between Reconstructions')
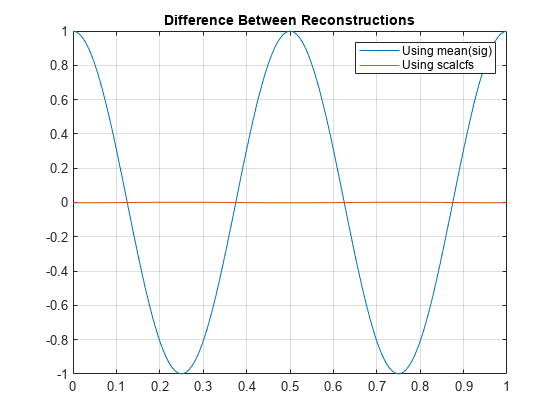
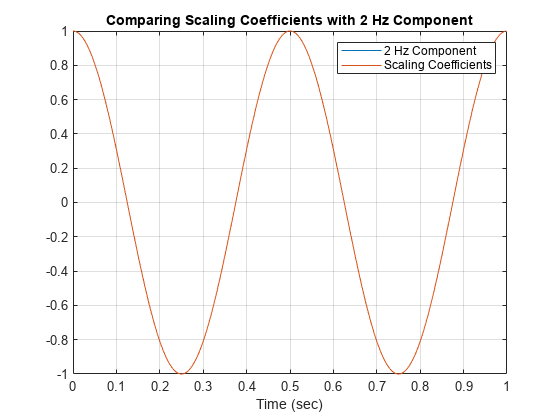
The scaling coefficients results in a significantly more accurate reconstruction. To investigate the source of the dramatic improvement, create a second signal consisting of the 2 Hz component of the original signal. Compare the scaling coefficients with the 2 Hz signal. The scaling coefficients and 2 Hz signal are virtually identical. Using the scaling coefficients helps with the reconstruction because the 2 Hz component is not representable by a wavelet with this sampling frequency and length.
figure sig2hz = cos(2*pi*2*t); plot(t,sig2hz) holdonplot(t,scalcfs) gridontitle('Comparing Scaling Coefficients with 2 Hz Component') xlabel('Time (sec)') legend('2 Hz Component','Scaling Coefficients')
Using CWT Filter Bank on Multiple Time Series
This example shows how using a CWT filter bank improves computational efficiency when taking the CWT of multiple time series.
Load the seismograph data recorded during the 1995 Kobe earthquake. The data are seismograph (vertical acceleration, nm/sq.sec) measurements recorded at Tasmania University, Hobart, Australia on 16 January 1995 beginning at 20:56:51 (GMT) and continuing for 51 minutes at 1 second intervals. Create a CWT filter bank that can be applied to the data.
loadkobefb = cwtfilterbank('SignalLength',numel(kobe),'SamplingFrequency',1);
Use thecwtfunction and take the CWT of the data 250 times. Display the elapsed time used.
num = 250; tic;fork=1:num cfs = cwt(kobe);endtoc
Elapsed time is 6.551628 seconds.
Now use thewtobject function of the filter bank to take the CWT of the data. Confirm using the filter bank is faster.
tic;fork=1:num cfs = wt(fb,kobe);endtoc
Elapsed time is 3.782376 seconds.
Input Arguments
输出Arguments
Tips
The first time you use a filter bank to take the CWT of a signal, the wavelet filters are constructed to have the same datatype as the signal. A warning message is generated when you apply the same filter bank to a signal with a different datatype. Changing datatypes comes with the cost of redesigning or changing the precision of the filter bank. For optimal performance, use a consistent datatype.
When performing multiple CWTs, for example inside a for-loop, the recommended workflow is to first create a
cwtfilterbankobject and then use thewtobject function. This workflow minimizes overhead and maximizes performance. SeeUsing CWT Filter Bank on Multiple Time Series.
Extended Capabilities
Select a Web Site
Choose a web site to get translated content where available and see local events and offers. Based on your location, we recommend that you select:.
Selectweb siteYou can also select a web site from the following list:
Americas
- América Latina(Español)
- Canada(English)
- United States(English)
Europe
- Belgium(English)
- Denmark(English)
- Deutschland(Deutsch)
- España(Español)
- Finland(English)
- France(Français)
- Ireland(English)
- Italia(Italiano)
- Luxembourg(English)
- Netherlands(English)
- Norway(English)
- Österreich(Deutsch)
- Portugal(English)
- Sweden(English)
- Switzerland
- United Kingdom(English)