Ground Plane and Obstacle Detection Using Lidar
This example shows how to process 3-D lidar data from a sensor mounted on a vehicle by segmenting the ground plane and finding nearby obstacles. This can facilitate drivable path planning for vehicle navigation. The example also shows how to visualize streaming lidar data.
创建一个Velodyne File Reader
The lidar data used in this example was recorded using a Velodyne® HDL32E sensor mounted on a vehicle. Set up avelodyneFileReader
fileName ='lidarData_ConstructionRoad.pcap'; deviceModel ='HDL32E'; veloReader = velodyneFileReader(fileName, deviceModel);
Read a Lidar Scan
每个扫描激光雷达数据存储作为一个3 d c点loud. Efficiently processing this data using fast indexing and search is key to the performance of the sensor processing pipeline. This efficiency is achieved using thepointCloud
TheveloReaderconstructs an organizedpointCloudfor each lidar scan. TheLocationproperty of thepointCloudis an M-by-N-by-3 matrix, containing the XYZ coordinates of points in meters. The point intensities are stored inIntensity.
% Read a scan of lidar dataptCloud = readFrame(veloReader)%#ok
ptCloud = pointCloud with properties: Location: [32×1083×3 single] Count: 34656 XLimits: [-80.0444 87.1780] YLimits: [-85.6287 92.8721] ZLimits: [-21.6060 14.3558] Color: [] Normal: [] Intensity: [32×1083 uint8]
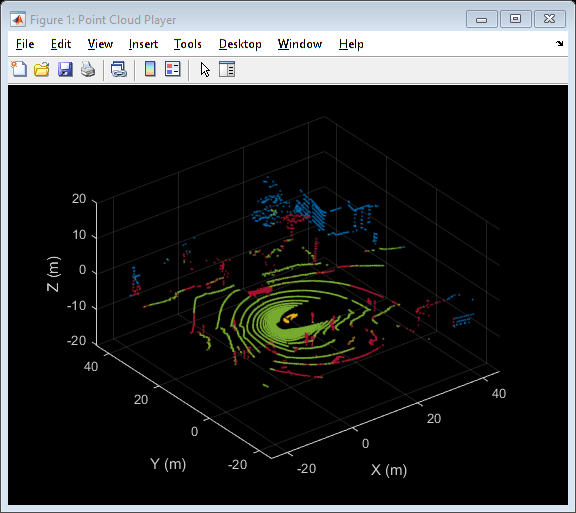
Setup Streaming Point Cloud Display
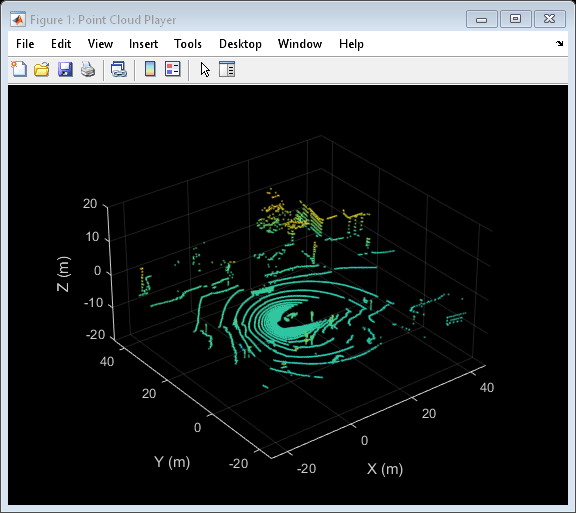
Thepcplayercan be used to visualize streaming point cloud data. Set up the region around the vehicle to display by configuringpcplayer
% Specify limits of point cloud displayxlimits = [-25 45];% metersylimits = [-25 45]; zlimits = [-20 20];% Create a pcplayerlidarViewer = pcplayer(xlimits, ylimits, zlimits);% Customize player axes labelsxlabel(lidarViewer.Axes,'X (m)')ylabel(lidarViewer.Axes,'Y (m)')zlabel(lidarViewer.Axes,'Z (m)')% Display the raw lidar scanview(lidarViewer, ptCloud)
In this example, we will be segmenting points belonging to the ground plane, the ego vehicle and nearby obstacles. Set the colormap for labeling these points.
% Define labels to use for segmented pointscolorLabels = [...0 0.4470 0.7410;...% Unlabeled points, specified as [R,G,B]0.4660 0.6740 0.1880;...% Ground points0.9290 0.6940 0.1250;...% Ego points0.6350 0.0780 0.1840];% Obstacle points% Define indices for each labelcolors.Unlabeled = 1; colors.Ground = 2; colors.Ego = 3; colors.Obstacle = 4;% Set the colormapcolormap(lidarViewer.Axes, colorLabels)

Segment the Ego Vehicle
The lidar is mounted on top of the vehicle, and the point cloud may contain points belonging to the vehicle itself, such as on the roof or hood. Knowing the dimensions of the vehicle, we can segment out points that are closest to the vehicle.
创建一个vehicleDimensions
vehicleDims = vehicleDimensions();% Typical vehicle 4.7m by 1.8m by 1.4m
Specify the mounting location of the lidar in the vehicle coordinate system. The vehicle coordinate system is centered at the center of the rear-axle, on the ground, with positive X direction pointing forward, positive Y towards the left, and positive Z upwards. In this example, the lidar is mounted on the top center of the vehicle, parallel to the ground.
mountLocation = [...vehicleDims.Length/2 - vehicleDims.RearOverhang,...% x0,...% yvehicleDims.Height];% z
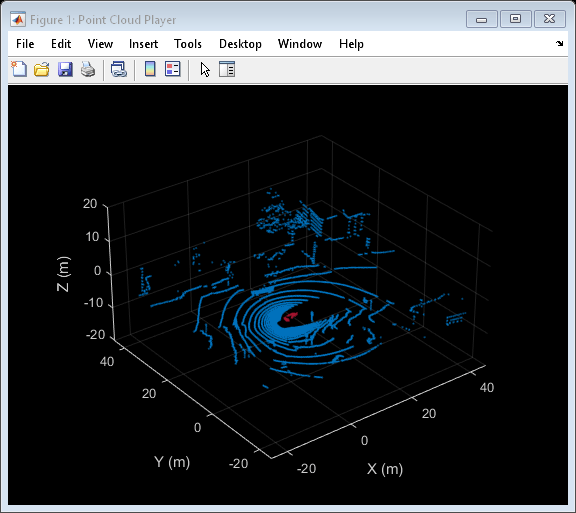
Segment the ego vehicle using the helper functionhelperSegmentEgoFromLidarData. This function segments all points within the cuboid defined by the ego vehicle. Store the segmented points in a structpoints.
points = struct(); points.EgoPoints = helperSegmentEgoFromLidarData(ptCloud, vehicleDims, mountLocation);
Visualize the point cloud with segmented ego vehicle. Use thehelperUpdateViewhelper function.
closePlayer = false; helperUpdateView(lidarViewer, ptCloud, points, colors, closePlayer);
Segment Ground Plane and Nearby Obstacles
In order to identify obstacles from the lidar data, first segment the ground plane using thesegmentGroundFromLidarData
elevationDelta = 10; points.GroundPoints = segmentGroundFromLidarData(ptCloud,'ElevationAngleDelta', elevationDelta);% Visualize the segmented ground plane.helperUpdateView(lidarViewer, ptCloud, points, colors, closePlayer);
Remove points belonging to the ego vehicle and the ground plane by using theselect'OutputSize'as'full'to retain the organized nature of the point cloud.
nonEgoGroundPoints = ~points.EgoPoints & ~points.GroundPoints; ptCloudSegmented = select(ptCloud, nonEgoGroundPoints,'OutputSize','full');
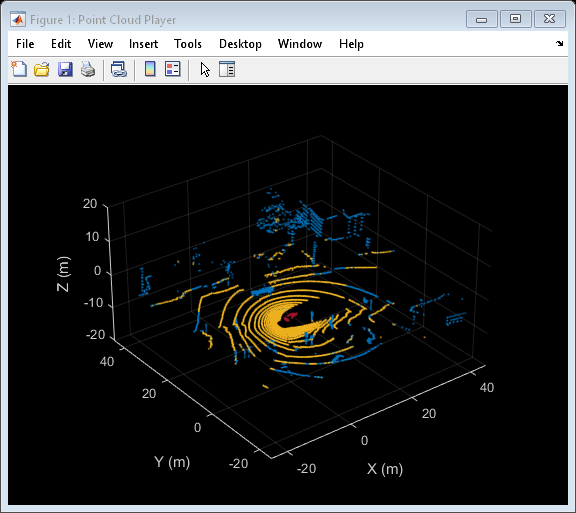
Next, segment nearby obstacles by looking for all points that are not part of the ground or ego vehicle within some radius from the ego vehicle. This radius can be determined based on the range of the lidar and area of interest for further processing.
sensorLocation = [0, 0, 0];% Sensor is at the center of the coordinate systemradius = 40;% meterspoints.ObstaclePoints = findNeighborsInRadius(ptCloudSegmented,...sensorLocation, radius);% Visualize the segmented obstacleshelperUpdateView(lidarViewer, ptCloud, points, colors, closePlayer);
Process Lidar Sequence
Now that the point cloud processing pipeline for a single lidar scan has been laid out, put this all together to process 30 seconds from the sequence of recorded data. The code below is shortened since the key parameters have been defined in the previous steps. Here, the parameters are used without further explanation.
% Rewind the |veloReader| to start from the beginning of the sequencereset(veloReader);% Stop processing after 30 secondsstopTime = veloReader.StartTime + seconds(30); isPlayerOpen = true;whilehasFrame(veloReader) && veloReader.CurrentTime < stopTime && isPlayerOpen% Grab the next lidar scanptCloud = readFrame(veloReader);% Segment points belonging to the ego vehiclepoints.EgoPoints = helperSegmentEgoFromLidarData(ptCloud, vehicleDims, mountLocation);% Segment points belonging to the ground planepoints.GroundPoints = segmentGroundFromLidarData(ptCloud,'ElevationAngleDelta', elevationDelta);% Remove points belonging to the ego vehicle and ground planenonEgoGroundPoints = ~points.EgoPoints & ~points.GroundPoints; ptCloudSegmented = select(ptCloud, nonEgoGroundPoints,'OutputSize','full');% Segment obstaclespoints.ObstaclePoints = findNeighborsInRadius(ptCloudSegmented, sensorLocation, radius); closePlayer = ~hasFrame(veloReader);% Update lidar displayisPlayerOpen = helperUpdateView(lidarViewer, ptCloud, points, colors, closePlayer);endsnapnow
Supporting Functions
helperSegmentEgoFromLidarDatasegments points belonging to the ego vehicle given the dimensions of the vehicle and mounting location.
functionegoPoints = helperSegmentEgoFromLidarData(ptCloud, vehicleDims, mountLocation)%helperSegmentEgoFromLidarData segment ego vehicle points from lidar data% egoPoints = helperSegmentEgoFromLidarData(ptCloud,vehicleDims,mountLocation)% segments points belonging to the ego vehicle of dimensions vehicleDims% from the lidar scan ptCloud. The lidar is mounted at location specified% by mountLocation in the vehicle coordinate system. ptCloud is a% pointCloud object. vehicleDimensions is a vehicleDimensions object.% mountLocation is a 3-element vector specifying XYZ location of the% lidar in the vehicle coordinate system.%% This function assumes that the lidar is mounted parallel to the ground% plane, with positive X direction pointing ahead of the vehicle,% positive Y direction pointing to the left of the vehicle in a% right-handed system.% Buffer around ego vehiclebufferZone = [0.1, 0.1, 0.1];% in meters% Define ego vehicle limits in vehicle coordinatesegoXMin = -vehicleDims.RearOverhang - bufferZone(1); egoXMax = egoXMin + vehicleDims.Length + bufferZone(1); egoYMin = -vehicleDims.Width/2 - bufferZone(2); egoYMax = egoYMin + vehicleDims.Width + bufferZone(2); egoZMin = 0 - bufferZone(3); egoZMax = egoZMin + vehicleDims.Height + bufferZone(3); egoXLimits = [egoXMin, egoXMax]; egoYLimits = [egoYMin, egoYMax]; egoZLimits = [egoZMin, egoZMax];% Transform to lidar coordinatesegoXLimits = egoXLimits - mountLocation(1); egoYLimits = egoYLimits - mountLocation(2); egoZLimits = egoZLimits - mountLocation(3);% Use logical indexing to select points inside ego vehicle cubeegoPoints = ptCloud.Location(:,:,1) > egoXLimits(1)...& ptCloud.Location(:,:,1) < egoXLimits(2)...& ptCloud.Location(:,:,2) > egoYLimits(1)...& ptCloud.Location(:,:,2) < egoYLimits(2)...& ptCloud.Location(:,:,3) > egoZLimits(1)...& ptCloud.Location(:,:,3) < egoZLimits(2);end
helperUpdateViewupdates the streaming point cloud display with the latest point cloud and associated color labels.
functionisPlayerOpen = helperUpdateView(lidarViewer, ptCloud, points, colors, closePlayer)%helperUpdateView update streaming point cloud display% isPlayerOpen = helperUpdateView(lidarViewer, ptCloud, points, colors, closePlayers)% updates the pcplayer object specified in lidarViewer with a new point% cloud ptCloud. Points specified in the struct points are colored% according to the colormap of lidarViewer using the labels specified by% the struct colors. closePlayer is a flag indicating whether to close% the lidarViewer.ifclosePlayer hide(lidarViewer); isPlayerOpen = false;return;endscanSize = size(ptCloud.Location); scanSize = scanSize(1:2);% Initialize colormapcolormapValues = ones(scanSize,'like', ptCloud.Location) * colors.Unlabeled;ifisfield(points,'GroundPoints')colormapValues(points.GroundPoints) = colors.Ground;endifisfield(points,'EgoPoints')colormapValues(points.EgoPoints) = colors.Ego;endifisfield(points,'ObstaclePoints')colormapValues(points.ObstaclePoints) = colors.Obstacle;end% Update viewview(lidarViewer, ptCloud.Location, colormapValues)% Check if player is openisPlayerOpen = isOpen(lidarViewer);end

See Also
Functions
Objects
Related Topics
Select a Web Site
Choose a web site to get translated content where available and see local events and offers. Based on your location, we recommend that you select:.
Selectweb siteYou can also select a web site from the following list:
Americas
- América Latina(Español)
- Canada(English)
- United States(English)
Europe
- Belgium(English)
- Denmark(English)
- Deutschland(Deutsch)
- España(Español)
- Finland(English)
- France(Français)
- Ireland(English)
- Italia(Italiano)
- Luxembourg(English)
- Netherlands(English)
- Norway(English)
- Österreich(Deutsch)
- Portugal(English)
- Sweden(English)
- Switzerland
- United Kingdom(English)