Load Ground Truth Signals to Label
TheGround Truth Labelerapp provides options for labeling two types of signals.
Image signalsare image-based. You can load these signals from sources such as videos or image sequences.
Point cloud signalsare lidar-based. You can load these signals from sources such as a sequence of point cloud files.
In this example, you load a video and a point cloud sequence into the app. These signals are taken from a camera sensor and a lidar sensor mounted to a vehicle. The signals represent the same driving scene.
Load Timestamps
Load the timestamps for the point cloud sequence. The timestamps are adurationvector that is in the same folder as the sequence. To load the timestamps, you must temporarily add this folder to the MATLAB®search path.
pcSeqFolder = fullfile (toolboxdir('driving'),'drivingdata','lidarSequence'); addpath(pcSeqFolder) loadtimestamps.matrmpath(pcSeqFolder)
The app also provides an option to specify timestamps for video sources. The video used in this example does not have a separate timestamps file, so when you load the video, you can read the timestamps directly from the video source.
Open Ground Truth Labeler App
To open theGround Truth Labelerapp, at the MATLAB command prompt, enter this command.
groundTruthLabeler
The app opens to an empty session.
Alternatively, you can open the app from theAppstab, underAutomotive.
Load Signals from Data Sources
TheGround Truth Labelerapp enables you to load signals from multiple types of data sources. In the app, adata sourceis a file or folder containing one or more signals to label.
For the video, the data source is an MP4 file that contains a single video.
For the point cloud sequence, the data source is a folder containing a sequence of point cloud data (PCD) files. Together, these files represent a single point cloud sequence.
Other data sources, such as rosbags, can contain multiple signals that you can load. For more details on the relationship between sources and signals, seeSources vs. Signals in Ground Truth Labeling.
Load Video
Load the video into the app.
On the app toolstrip, clickImport>Add Signals.
The Add/Remove Signal dialog box opens with theSource Typeparameter set to
Videoand theTimestampsparameter set toFrom File.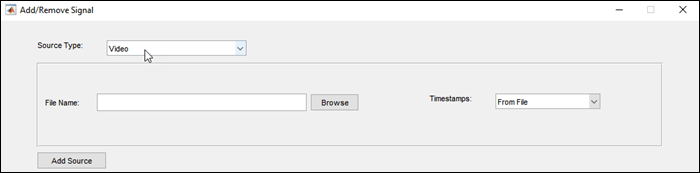
In theFile Nameparameter, browse for this video file.
matlabrootfunction.\toolbox\driving\drivingdata\01_city_c2s_fcw_10s.mp4 ClickAdd Source. The video loads into the app, and the app reads the timestamps directly from the video. The source table displays the information about the video data source.

Load Point Cloud Sequence
Load the point cloud sequence into the app.
添加/删除信号仍然打开一个对话框nd the video loaded, set theSource Typeparameter to
点云序列. The dialog box displays new options specific to loading point cloud sequences.
In theFolder Nameparameter, browse for the
lidarSequencefolder, which contains the sequence of point cloud data (PCD) files to load.\toolbox\driving\drivingdata\lidarSequence Set theTimestampsparameter to
From Workspace. In the Import From Workspace dialog box, select thetimestampsvariable that you loaded for the point cloud sequence. ClickOK.
ClickAdd Source. The point cloud sequence loads into the app, and the app reads the timestamps from the
timestampsvariable. The source table displays the information about the data source for the point cloud sequence.


Verify Information About Loaded Signals
The table at the bottom of the Add/Remove Signal dialog box displays information about the loaded signals. Verify that the table displays this information for the loaded signals.
TheSignal Namecolumn displays the signal names generated by the app. For the video, the signal name is the file name of the data source with the prefix
video_and with no file extension. For the point cloud sequence, the signal name is the name of the source folder.TheSourcecolumn displays the full file paths to the signal data sources.
TheSignal Typecolumn displays the type of each signal. The video is of type
Image. The point cloud sequence is of typePoint Cloud.TheTime Rangecolumn displays the duration of the signals based on the loaded timestamp data. Both signals are approximately 10 seconds long.
For the point cloud sequence, if you leftTimestampsset toUse Default, then theTime Rangevalue for the sequence ranges from 0 to 33 seconds. This range is based on the 34 PCD files in the folder. By default, the app sets the timestamps of a point cloud sequence to adurationvector from 0 to the number of valid point cloud files minus 1. Units are in seconds. If this issue occurs, in the table, select the check box for the point cloud sequence row. Then, clickDelete Selected, load the signal again, and verify the signal information again.
After verifying that the signals loaded correctly, clickOK. The app loads the signals and opens to the first frame of the last signal added, which for this example is the point cloud sequence.

Configure Signal Display
When you first load the signals, the app displays only one signal at a time. To display the signals side-by-side, first, on theLabeltab of the app toolstrip, clickDisplay Grid. Then, move the pointer to select a 1-by-2 grid and click the grid.
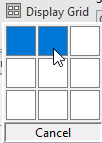
The video and point cloud sequence display side-by-side.

To view the video and point cloud sequence together, in the slider below the signals, click the Play button![]() . The video plays more smoothly than the point cloud sequence because the video has more frames over approximately the same amount of time and therefore a higher frame rate.
. The video plays more smoothly than the point cloud sequence because the video has more frames over approximately the same amount of time and therefore a higher frame rate.
By default, the app plays all frames from the signal with the highest frame rate. This signal is called themain signal. For all other signals, the app displays the frame that is time-aligned with the currently displaying frame of the main signal. To configure which signal is the main signal, use the options in the Playback Control Settings dialog box. To open this dialog box, below the slider, click the clock settings button![]() . For more details about using these options to control the display of signal frames, seeControl Playback of Signal Frames for Labeling.
. For more details about using these options to control the display of signal frames, seeControl Playback of Signal Frames for Labeling.
After loading the signal and viewing the frames, you can now create label definitions and label the data, as described inLabel Ground Truth for Multiple Signals.
Related Topics
You can also select a web site from the following list:
Americas
- América Latina(Español)
- Canada(English)
- United States(English)
Europe
- Belgium(English)
- Denmark(English)
- Deutschland(Deutsch)
- España(Español)
- Finland(English)
- France(Français)
- Ireland(English)
- Italia(Italiano)
- Luxembourg(English)
- Netherlands(English)
- Norway(English)
- Österreich(Deutsch)
- Portugal(English)
- Sweden(English)
- Switzerland
- United Kingdom(English)